2026-03-12
体验基于Greptime的智能体可观测方案
刷微信公众号时候看到一条来自Greptime的文章,内容是基于他们家的GreptimeDB来搭建智能体可观测平台。
效果如下: 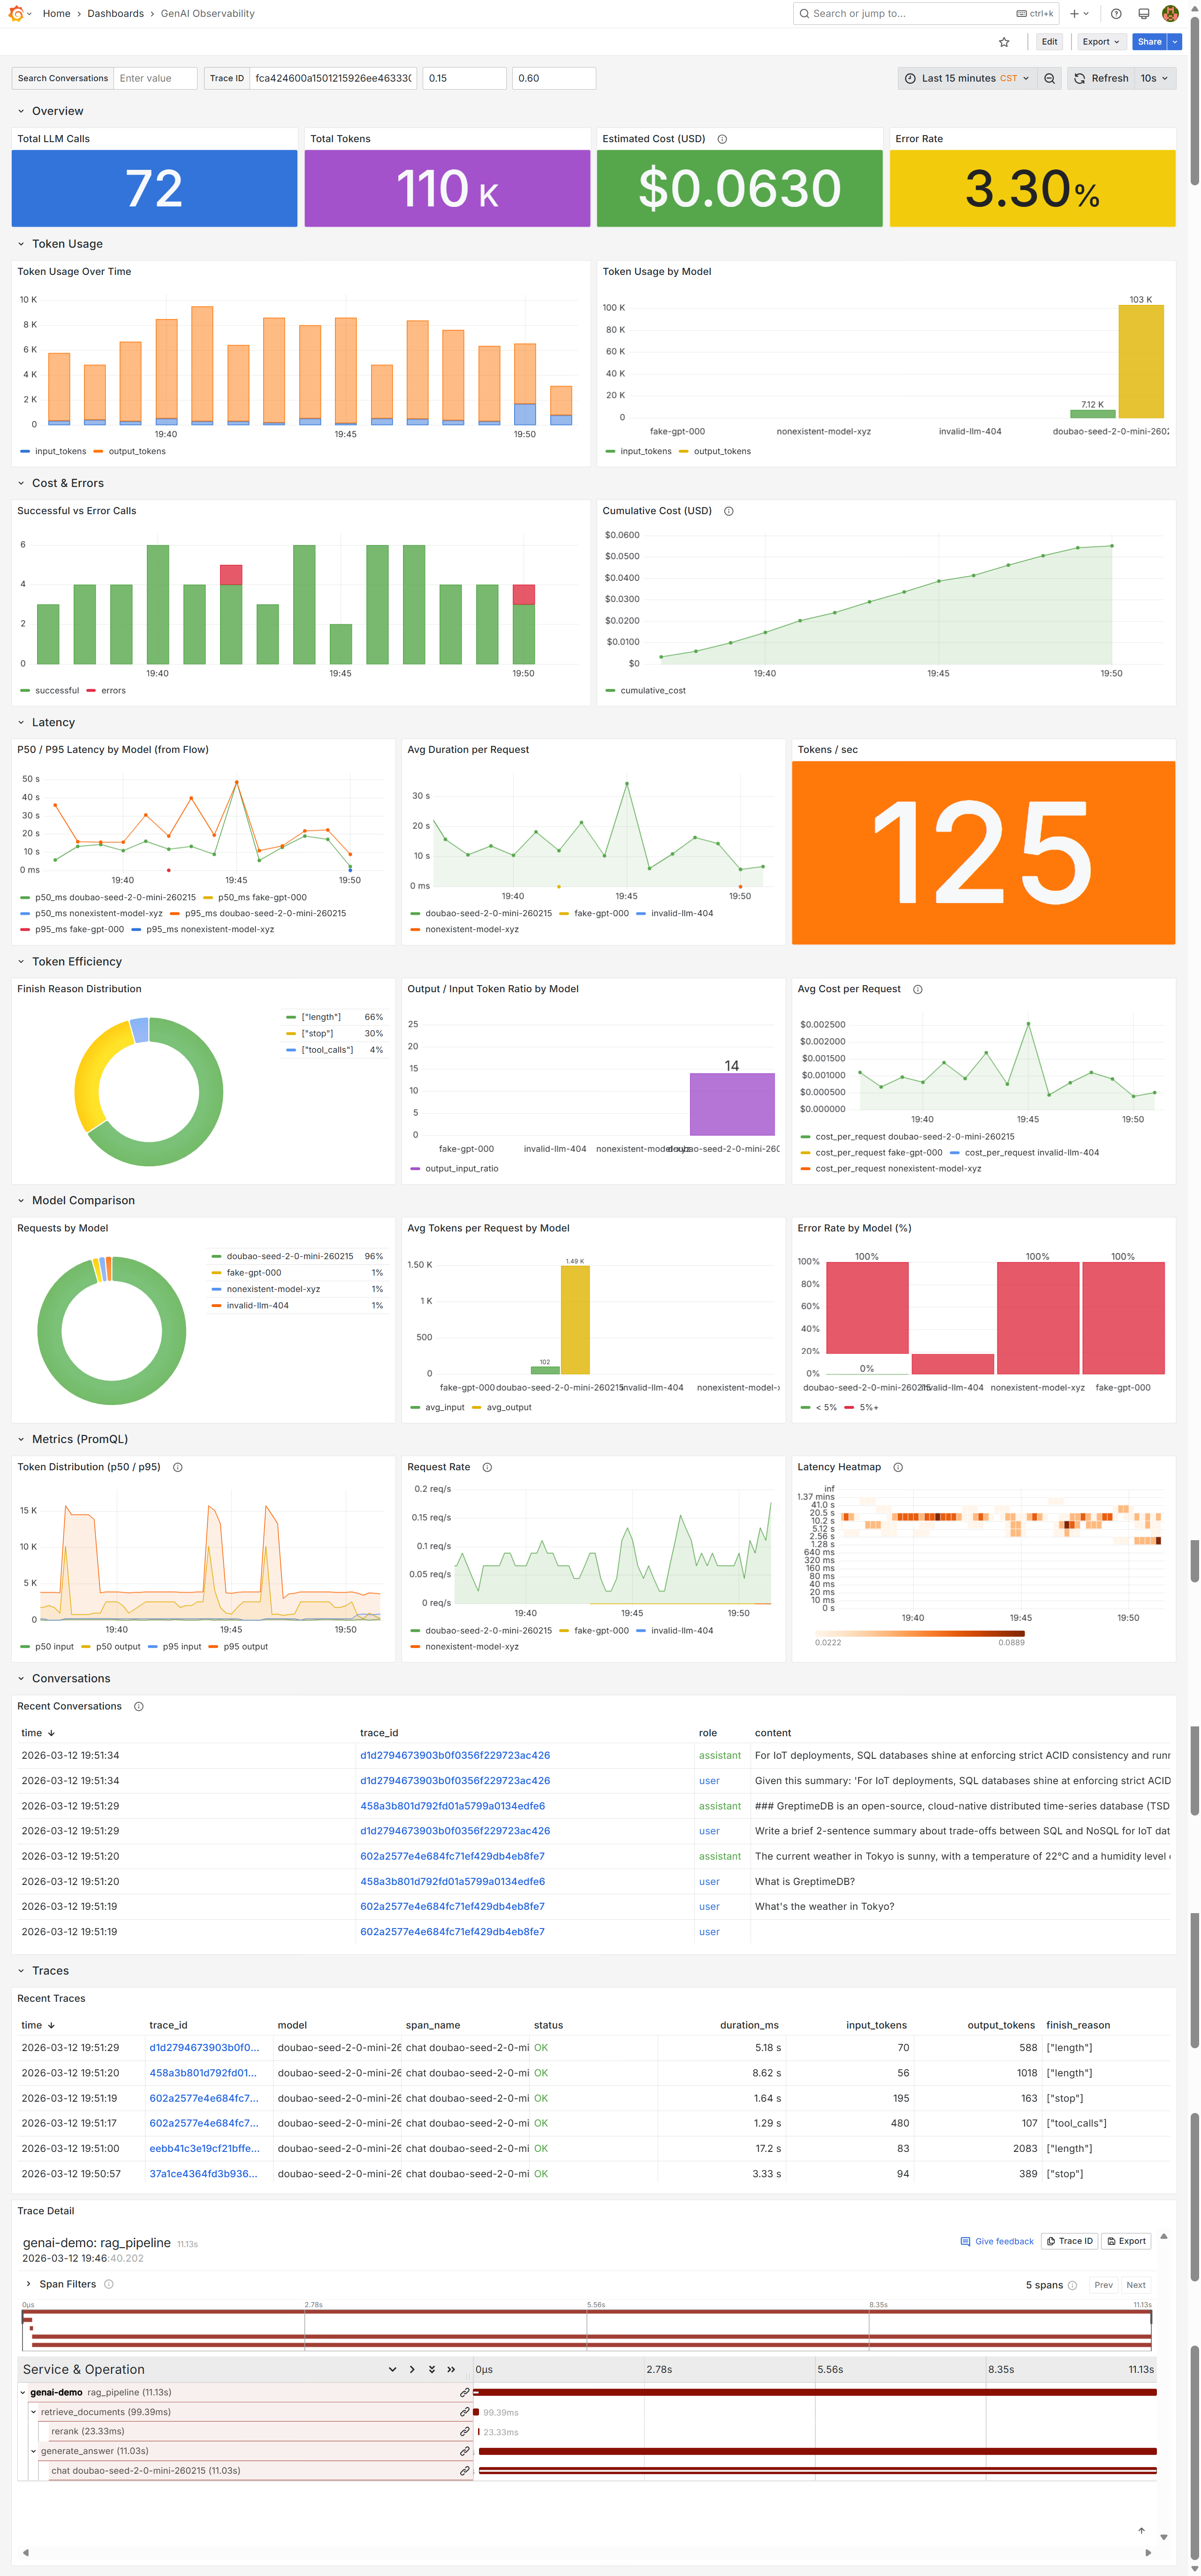
架构如下(根据原文内容,用Kimi生成):
%%{init: {'theme': 'base', 'themeVariables': { 'primaryColor': '#E8F5E9', 'primaryTextColor': '#1B5E20', 'primaryBorderColor': '#4CAF50', 'lineColor': '#FF9800', 'secondaryColor': '#E3F2FD', 'tertiaryColor': '#FFF3E0', 'fontFamily': 'Inter', 'clusterBkg': '#FAFAFA', 'clusterBorder': '#E0E0E0', 'titleColor': '#212121'}}}%%

flowchart TB
    subgraph App["🚀 GenAI App (Python)"]
        direction TB
        A1["OpenAI SDK / Anthropic / Azure / Bedrock"]
        A2["opentelemetry-instrumentation-openai-v2"]
        A3["自动产生 Traces + Metrics + Logs"]
        A4["OTEL_INSTRUMENTATION_GENAI_CAPTURE_MESSAGE_CONTENT=true"]
        A5["捕获完整 Prompt / Completion"]
    end

    subgraph Transport["📡 数据传输"]
        direction TB
        T1["OTLP/HTTP 直写 GreptimeDB"]
        T2["无 OTel Collector(Demo/小规模)"]
        T3["生产环境可加 Collector 做采样/脱敏"]
    end

    subgraph GreptimeDB["🗄️ GreptimeDB 统一后端"]
        direction TB

        subgraph Ingestion["数据接入端点"]
            I1["/v1/otlp/v1/traces → opentelemetry_traces"]
            I2["/v1/otlp/v1/metrics → OTel metrics"]
            I3["/v1/otlp/v1/logs → genai_conversations"]
        end

        subgraph Storage["数据存储"]
            S1["opentelemetry_traces"]
            S1_detail["span_attributes.gen_ai.* 展平为列"]
            S2["genai_conversations"]
            S2_detail["body 列全文索引,可搜索对话内容"]
            S3["OTel Metrics(Histogram)"]
            S3_detail["gen_ai_client_operation_duration_seconds"]
            S4["gen_ai_client_token_usage"]
        end

        subgraph Flow["⚡ Flow 流计算引擎"]
            F1["genai_token_usage_1m"]
            F1_detail["每分钟每模型 Token 聚合"]
            F2["genai_latency_1m"]
            F2_detail["uddsketch 分位数 p50/p95/p99"]
            F3["自动过期 EXPIRE AFTER '24h'"]
        end
    end

    subgraph Grafana["📊 Grafana 统一可视化"]
        direction TB

        subgraph SQLPanel["SQL 查询面板"]
            G1["跨表关联:traces JOIN conversations"]
            G1_detail["通过 trace_id + span_id 关联"]
            G2["全文搜索:matches_term(body, '关键词')"]
            G3["成本估算 / 错误率统计"]
        end

        subgraph PromQLPanel["PromQL 查询面板"]
            G4["histogram_quantile(0.95, ...)"]
            G5["Token 分布 / 延迟分位数"]
        end

        subgraph TracePanel["Trace 瀑布图"]
            G6["GreptimeDB Grafana 插件"]
            G6_detail["嵌套 Span 树:tool_call / RAG / multi-agent"]
            G7["点击 trace_id 一键跳转"]
        end
    end

    App --> Transport
    Transport --> GreptimeDB
    GreptimeDB --> Grafana

    %% 样式定义
    style App fill:#E8F5E9,stroke:#2E7D32,stroke-width:3px,color:#1B5E20
    style A1 fill:#C8E6C9,stroke:#4CAF50,stroke-width:2px,color:#1B5E20
    style A2 fill:#A5D6A7,stroke:#4CAF50,stroke-width:2px,color:#1B5E20
    style A3 fill:#C8E6C9,stroke:#4CAF50,stroke-width:1px,color:#2E7D32
    style A4 fill:#E8F5E9,stroke:#81C784,stroke-width:1px,color:#2E7D32
    style A5 fill:#E8F5E9,stroke:#81C784,stroke-width:1px,color:#2E7D32

    style Transport fill:#FFF8E1,stroke:#F57F17,stroke-width:2px,color:#E65100
    style T1 fill:#FFECB3,stroke:#FFB300,stroke-width:2px,color:#E65100
    style T2 fill:#FFF8E1,stroke:#FFD54F,stroke-width:1px,color:#F57F17
    style T3 fill:#FFF8E1,stroke:#FFD54F,stroke-width:1px,color:#F57F17

    style GreptimeDB fill:#E3F2FD,stroke:#1565C0,stroke-width:3px,color:#0D47A1
    style Ingestion fill:#BBDEFB,stroke:#1976D2,stroke-width:2px,color:#0D47A1
    style I1 fill:#E3F2FD,stroke:#42A5F5,stroke-width:1px,color:#1565C0
    style I2 fill:#E3F2FD,stroke:#42A5F5,stroke-width:1px,color:#1565C0
    style I3 fill:#E3F2FD,stroke:#42A5F5,stroke-width:1px,color:#1565C0
    style Storage fill:#BBDEFB,stroke:#1976D2,stroke-width:2px,color:#0D47A1
    style S1 fill:#E3F2FD,stroke:#42A5F5,stroke-width:1px,color:#1565C0
    style S1_detail fill:#E3F2FD,stroke:#90CAF9,stroke-width:1px,color:#1565C0
    style S2 fill:#E3F2FD,stroke:#42A5F5,stroke-width:1px,color:#1565C0
    style S2_detail fill:#E3F2FD,stroke:#90CAF9,stroke-width:1px,color:#1565C0
    style S3 fill:#E3F2FD,stroke:#42A5F5,stroke-width:1px,color:#1565C0
    style S3_detail fill:#E3F2FD,stroke:#90CAF9,stroke-width:1px,color:#1565C0
    style S4 fill:#E3F2FD,stroke:#42A5F5,stroke-width:1px,color:#1565C0
    style Flow fill:#BBDEFB,stroke:#1976D2,stroke-width:2px,color:#0D47A1
    style F1 fill:#E3F2FD,stroke:#42A5F5,stroke-width:1px,color:#1565C0
    style F1_detail fill:#E3F2FD,stroke:#90CAF9,stroke-width:1px,color:#1565C0
    style F2 fill:#E3F2FD,stroke:#42A5F5,stroke-width:1px,color:#1565C0
    style F2_detail fill:#E3F2FD,stroke:#90CAF9,stroke-width:1px,color:#1565C0
    style F3 fill:#E3F2FD,stroke:#42A5F5,stroke-width:1px,color:#1565C0

    style Grafana fill:#FFF3E0,stroke:#E65100,stroke-width:3px,color:#BF360C
    style SQLPanel fill:#FFE0B2,stroke:#F57C00,stroke-width:2px,color:#E65100
    style G1 fill:#FFF3E0,stroke:#FFB74D,stroke-width:1px,color:#E65100
    style G1_detail fill:#FFF3E0,stroke:#FFCC80,stroke-width:1px,color:#E65100
    style G2 fill:#FFF3E0,stroke:#FFB74D,stroke-width:1px,color:#E65100
    style G3 fill:#FFF3E0,stroke:#FFB74D,stroke-width:1px,color:#E65100
    style PromQLPanel fill:#FFE0B2,stroke:#F57C00,stroke-width:2px,color:#E65100
    style G4 fill:#FFF3E0,stroke:#FFB74D,stroke-width:1px,color:#E65100
    style G5 fill:#FFF3E0,stroke:#FFB74D,stroke-width:1px,color:#E65100
    style TracePanel fill:#FFE0B2,stroke:#F57C00,stroke-width:2px,color:#E65100
    style G6 fill:#FFF3E0,stroke:#FFB74D,stroke-width:1px,color:#E65100
    style G6_detail fill:#FFF3E0,stroke:#FFCC80,stroke-width:1px,color:#E65100
    style G7 fill:#FFF3E0,stroke:#FFB74D,stroke-width:1px,color:#E65100
与传统方案的不同
在观测LLM应用的时候,通常会同时关注多种内容,这时就需要从Traces跳到Logs中,在之前的实践中有遇到过,虽可在Jaeger的数据源中设置Traces to Logs,但并不能让Logs中记录的LLM消息出现在Traces瀑布的span中,而是点击后跳转,观感与Langsmith、Langfuse这类专门为智能体设计的可观测平台相比有一些差距。
不同于上述将三类信号分别存储的方案,这个方案将它们存到了一个GreptimeDB数据库中。在应用侧,配置三类信号发往特定的端点即可。
Greptime 的优势
元宝总结:
三类信号统一存储,支持跨信号关联查询:Traces、Metrics和Logs存储在GreptimeDB的不同表中,但共享
trace_id等关联键,使得用一条SQL即可关联查询某个高延迟请求的token用量及其完整的对话内容,解决了传统方案中需跨系统手动拼接数据的难题。利用Flow实现从原始Span到指标的实时聚合:无需应用层重复上报指标。通过GreptimeDB的流处理引擎Flow,可以定义聚合任务,直接从包含丰富属性的Span数据中实时聚合出每分钟的token用量、延迟分位数(使用
uddsketch函数)等关键指标,避免了数据双写和冗余计算。原始对话内容可搜索,并与Trace无缝链接:开启内容捕获后,完整的用户提示词和AI回复可作为日志存储,并利用
matches_term()函数进行全文索引检索。在Grafana看板中,用户可以搜索对话关键词,并直接通过trace_id链接跳转到对应的Trace瀑布图,实现了从问题现象(“AI回答不好”)到根本原因(慢查询、特定工具调用等)的快速追踪。
Data Not Found?
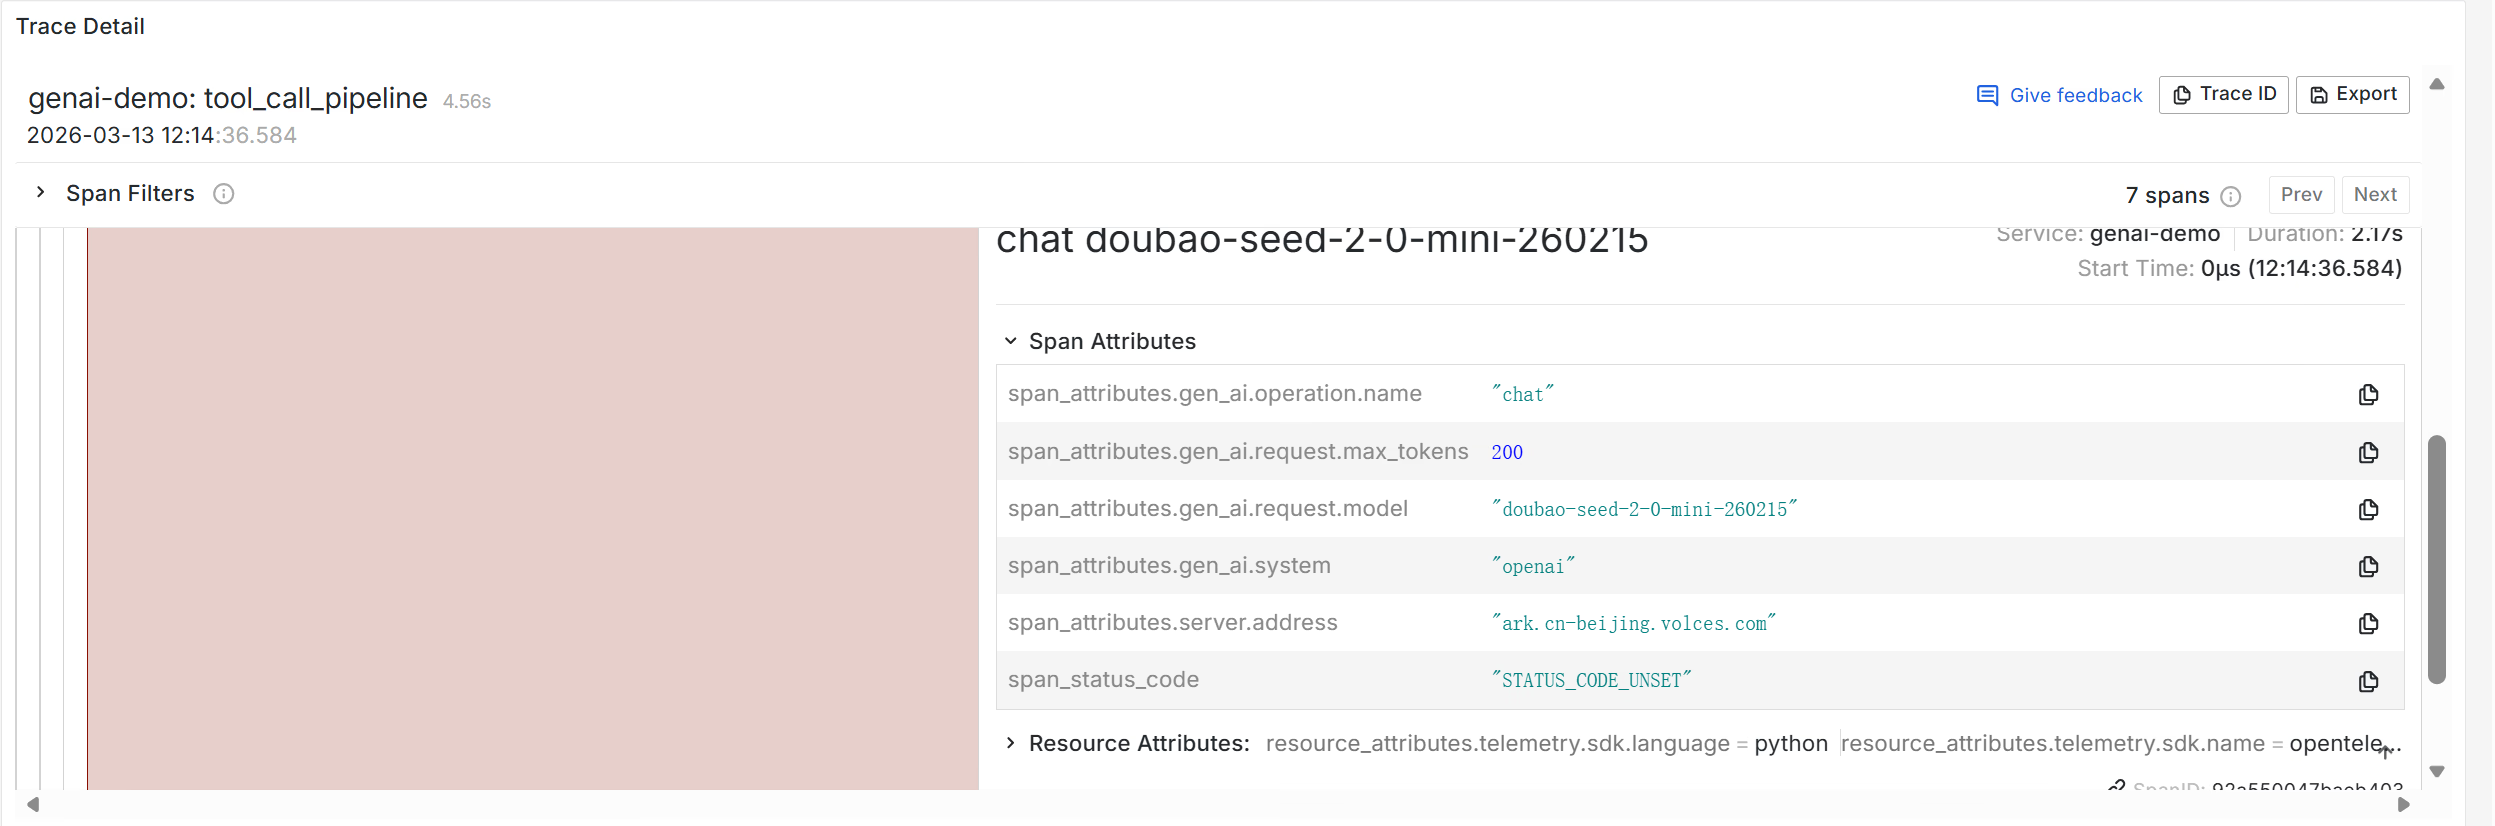
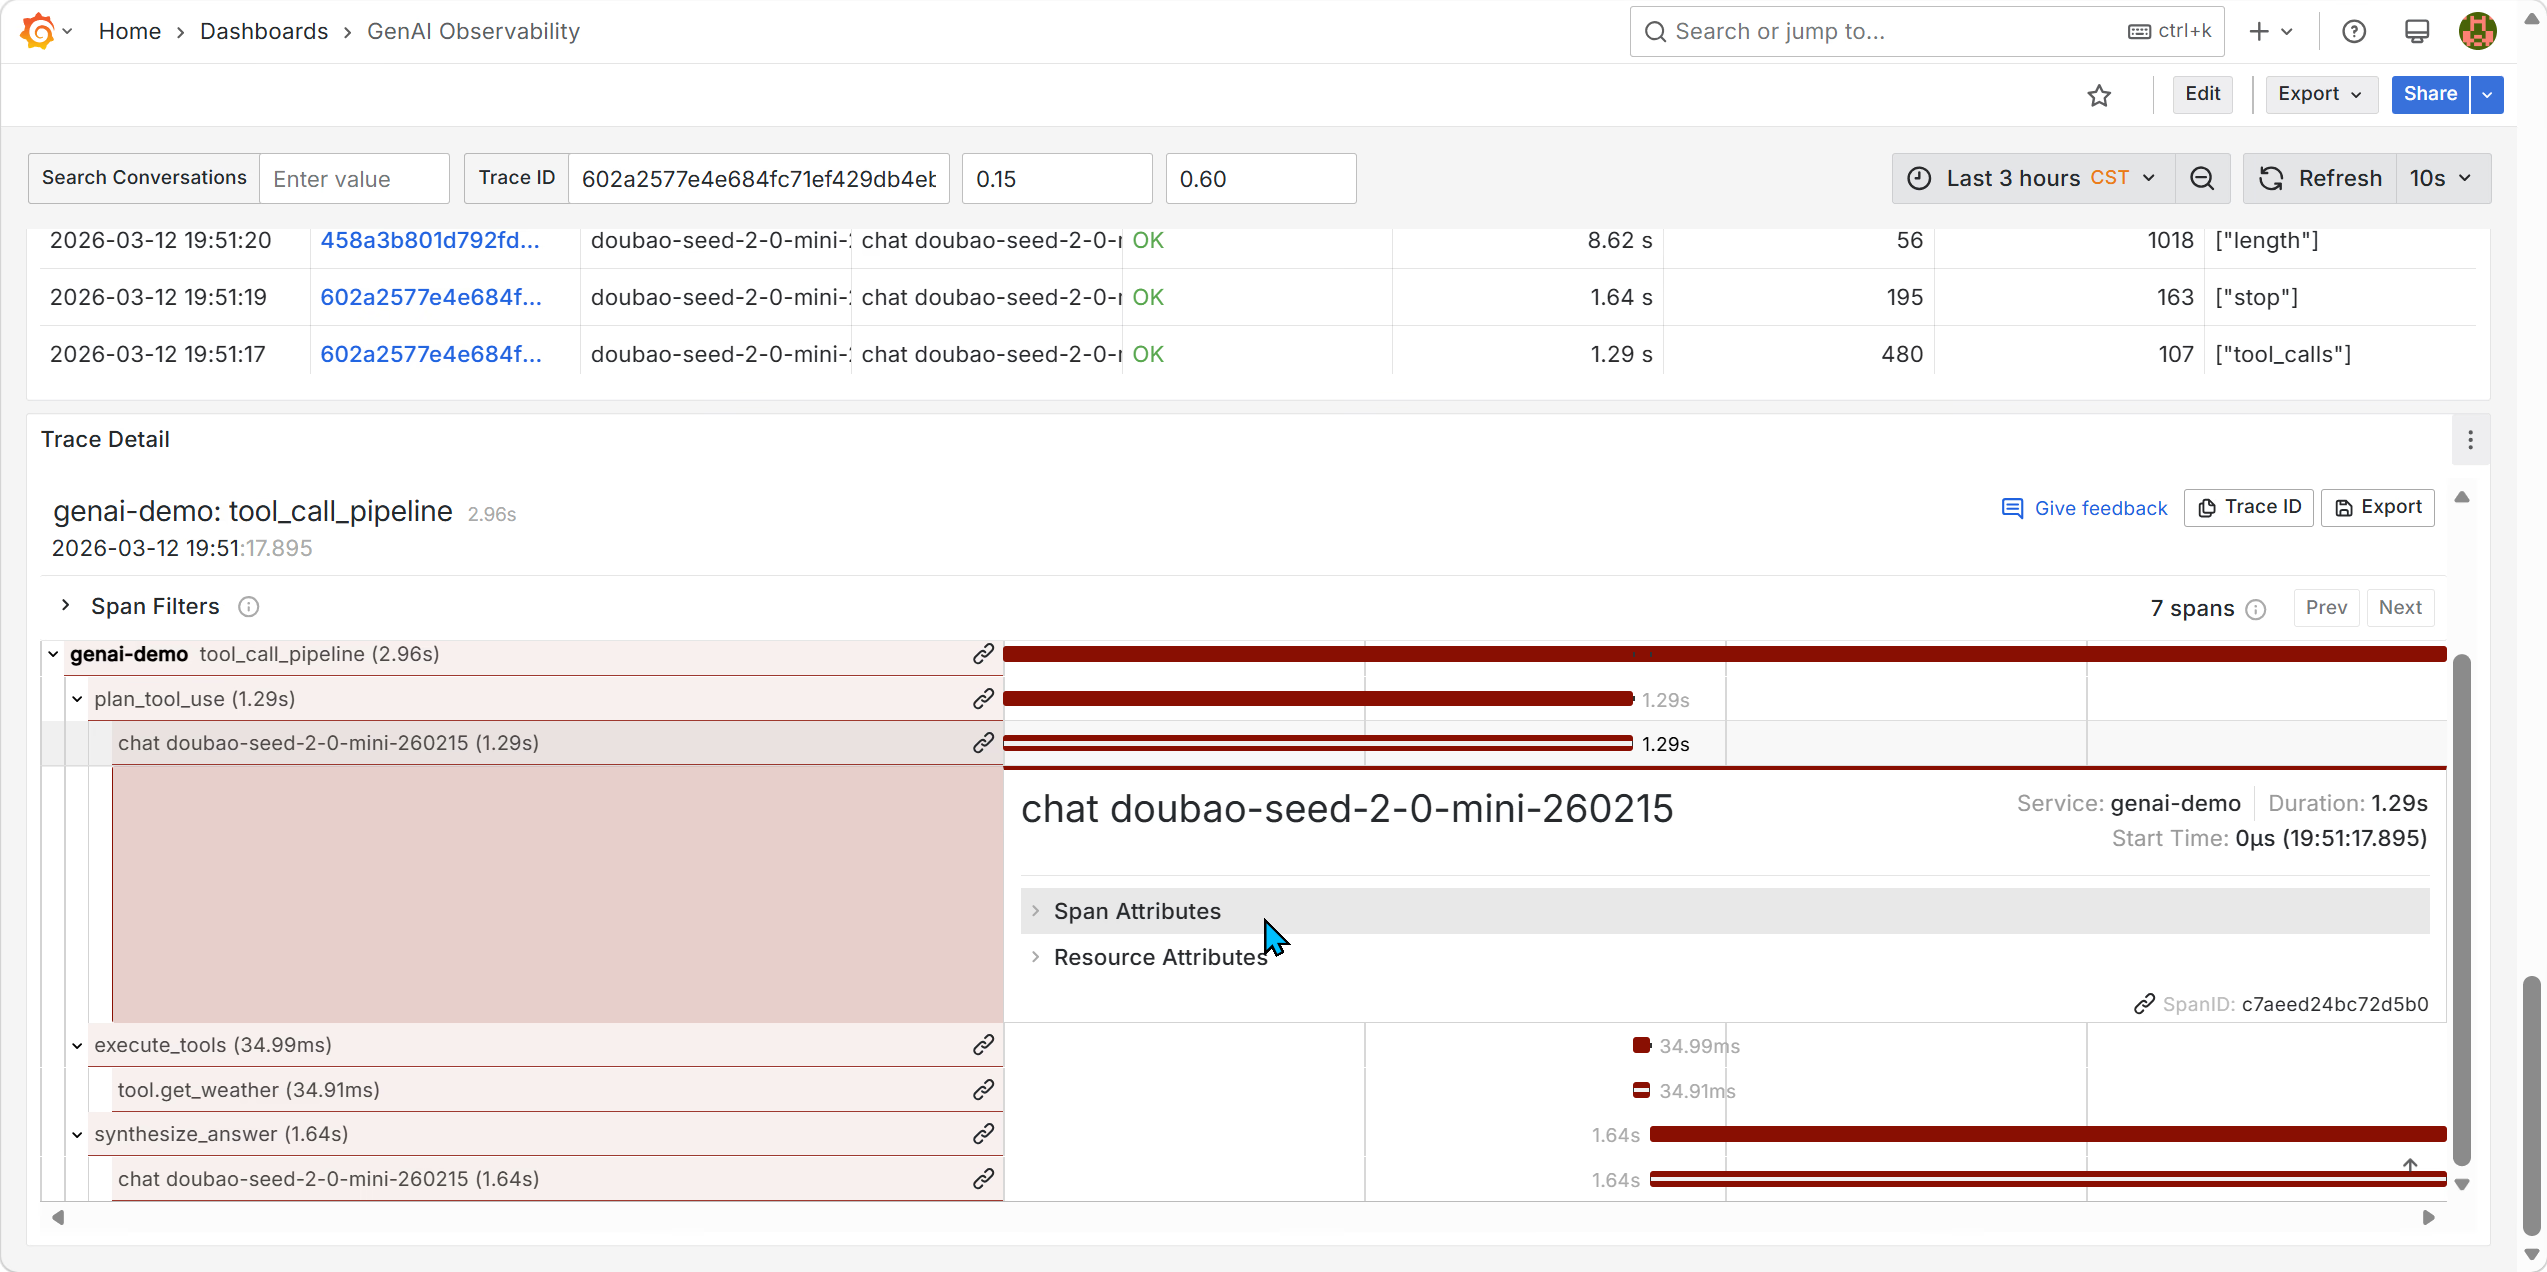
在体验的过程中遇到了小插曲,我发现Trace瀑布中的Span属性点不开。
尝试分析这个问题:
- 了解此Visualization是如何构造的
- 点击Edit,进入编辑模式
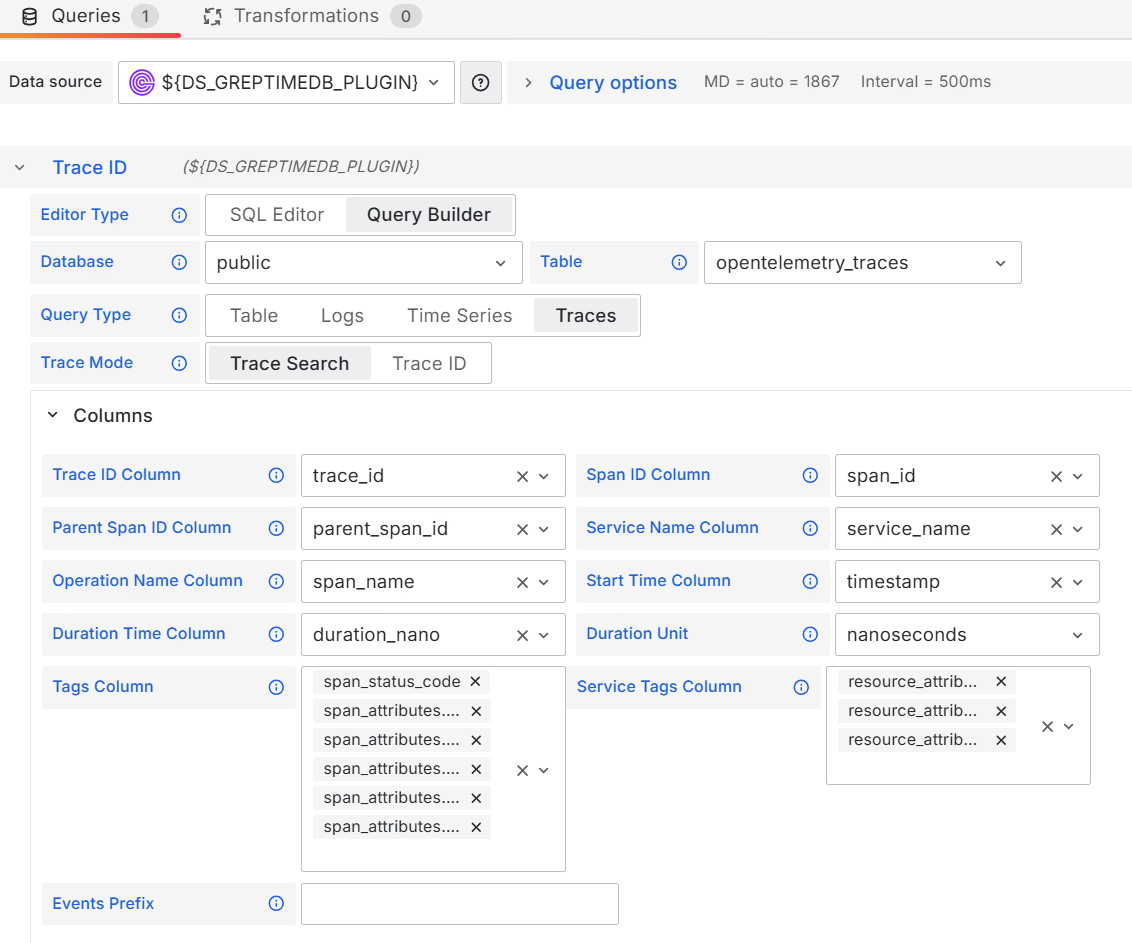
- 发现这个内容应是通过GreptimeDB插件进行SQL查询得到的
- 猜想:是SQL查询语句有问题?将这里的语句在GreptimeDB面板运行,没问题
- 猜想:是否是没记录Span Attributes?查看opentelemetry_traces表,确认已经记录上了
- 猜想:和这个Columns/Tags Column有关系?但是我选上之后显示Data Not Found
此是已是晚上八点,我在GreptimeDB的技术交流群里向专家老师请教了这个问题。 我想着,一觉醒来应该就有答案了。 未曾想,开发团队九点就修复了这个问题。
怎么解决的呢? 通过Git Diff发现是在grafana/dashboards/genai.json文件里作的修改,修改了该面板的查询语句(rawSql)和列定义(columns)。
重新拉一个Grafana容器起来,果不其然!
现在可以看到Span Attributes的内容了。