Summer of Open Source 2025
- Project Name: Rust Implementation of openEuler System Resource Observability Components in Satellite Scenarios
- Completion Link: https://summer-ospp.ac.cn/org/prodetail/25b970284?lang=zh&list=pro
- Development Repository: https://gitee.com/shangyingjie/rust-collector
- One-Click Docker Test Environment: https://gitee.com/shangyingjie/rust-collector-demo
- PR Link: https://gitee.com/shangyingjie/oee_archive
Background
It was summer break, and my mom and I rented a place in Beijing. The internship I originally arranged fell through, so after much reflection, I went into full-on internship-hunting mode. 
Interviewing using Pocket in a rental apartment
How It Started
For Summer of Open Source 2025, I looked at projects in the observability and RAG areas. One extremely cool project caught my eye — “Rust Implementation of openEuler System Resource Observability Components in Satellite Scenarios”. It fascinated me for three reasons:
- Satellite Scenarios: I’d never worked with this before — felt fresh and exciting, like reaching for the stars.
- Observability: This was my target job hunting field — it seemed full of potential.
- Rust: This project would help me level up my Rust programming skills.
Ultimately, it was career-oriented. I chose the observability track because:
- I had some background here: during an open-source internship in 2022, I wrote test cases for Prometheus in the openEuler community QA-SIG, and in Summer of Open Source 2024, I implemented observability with Prometheus for Ant Group’s RustyVault.
- I felt the observability track wasn’t as competitive as AI.
Since my undergrad days, I’ve had a habit of picking less crowded paths, but I kept switching lanes — without going deep, it doesn’t work.
The Interview
After deciding on the project, I sent an email to the mentor from my school account, explaining my background in observability and my strong desire for this project, hoping they’d give me a chance to interview. The mentor replied quickly, inviting me to talk with the team. During the conversation, I learned that other students had also reached out. Afterward, I worked even harder on “pre-research” for the project, producing a proposal with high “completion.”
Pre-Research & Writing the Proposal
The OTel Collector in the cloud-native observability space is resource-heavy, which isn’t ideal for current satellite computing scenarios. So this project aimed to rewrite the OpenTelemetry Collector in Rust to reduce resource consumption.
- The OTel Collector designed for cloud data centers maintains an in-memory queue to cache telemetry signals, avoiding disk reads, which reduces latency to the observability backend.
I read the official docs and roughly identified the Collector’s main components and their purposes. I downloaded the source code and estimated the amount of code needed for the rewrite. As I went deeper, I realized the challenge: the most basic Collector functionality in the official Go implementation requires hundreds of thousands of lines. After discussing with AI, translating it line by line into Rust might require 1.5 times the code…
There’s a misconception here: rewriting doesn’t mean line-by-line translation. You should understand the target software and leverage language features for implementation.
Below is the cover of my proposal, generated by AI: a telescope growing from the ground, reaching up to a satellite in space, observing its status. 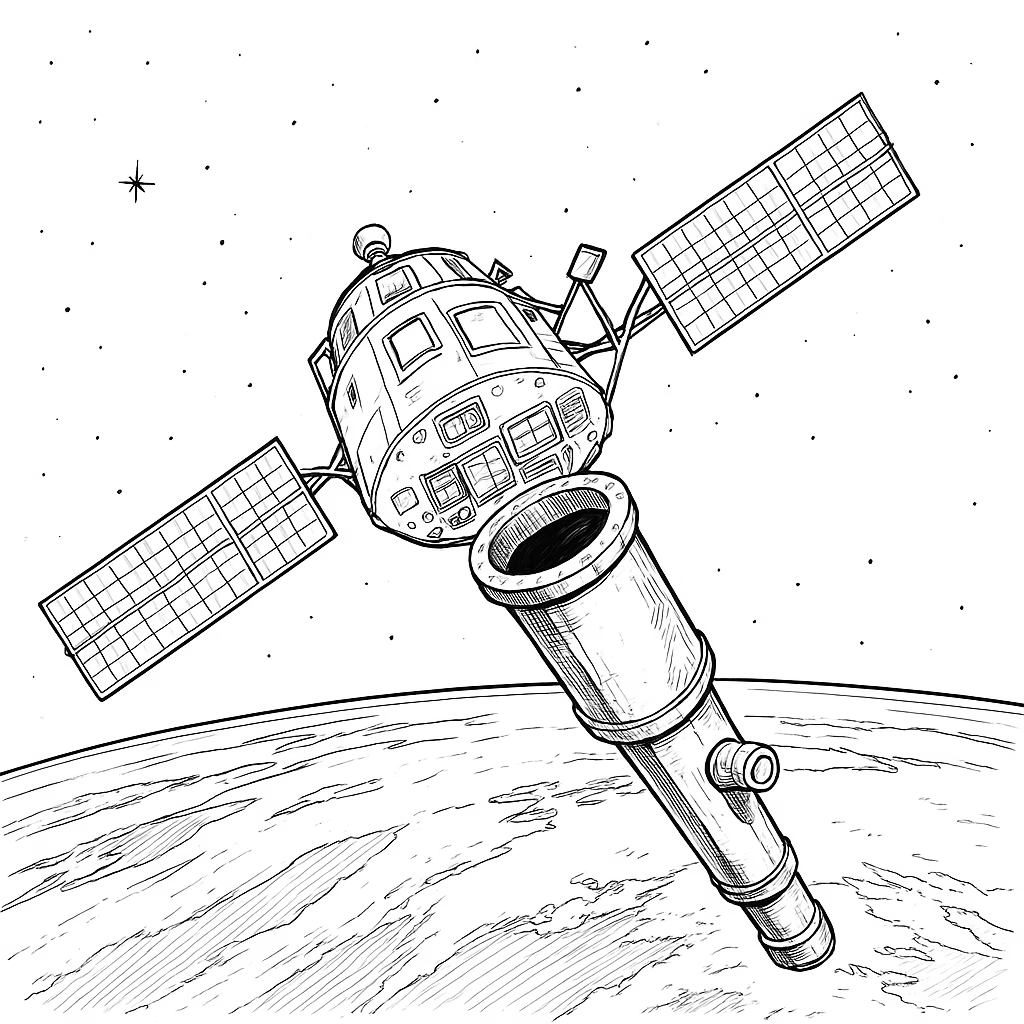
Kick-off Meeting
During the kick-off, we agreed on a weekly sync-up cadence (single-week reports) for faster alignment and correction. If we went off track, this would help us catch and fix it early.
The project had three phases:
- Phase 1: Read the source code, understand how the OTel Collector’s main components are implemented.
- Phase 2: Rewrite in Rust.
- Phase 3: Build a demo.
Reading the Source Code
AI Shortcuts
I tried tools like DeepWiki, hoping AI could directly tell me the core principles of the entire codebase. Unfortunately, the AI’s output was no more insightful than the docs — not what I wanted.
- What I wanted: "The project consists of components A, B, C, D. A is implemented via…, B via…, C via…, D via…; data flows A→B→C→D via…"
Old School
Realizing my use of AI wasn’t delivering, I went Old School to read the source code.
Static Analysis
By “static analysis,” I mean reading line by line. The OTel Collector’s design is clever — users can flexibly assemble Collectors using various extensions based on business needs. But this complexity made it harder for me to understand the source. The official implementation uses many design patterns, and static reading alone was often insufficient. I decided to use dynamic debugging — my go-to weapon for understanding a new project.
Dynamic Debugging
The OTel Collector works like this: users write a config file, then use a builder to construct the Collector. The generated files include a main.go. My first breakpoint was in main.go. A new problem emerged: after days of debugging, I was still stuck in the initialization phase, far from the Receiver component I wanted to examine. Why not breakpoint directly in the Receiver code? Because I couldn’t find the component’s entry point.
The mentor suggested tools for function call analysis. After some searching, I found Delve. Actually, when debugging Go projects in VS Code, I was already using Delve — I just hadn’t used it separately from the command line. Delve can print the lines of code a Go project passes through during execution. With regex, you can output target module content.
To inspect the OtlpExporter component, I used:
'go\.opentelemetry\.io/collector/exporter/otlpexporter(/.*)?\..*'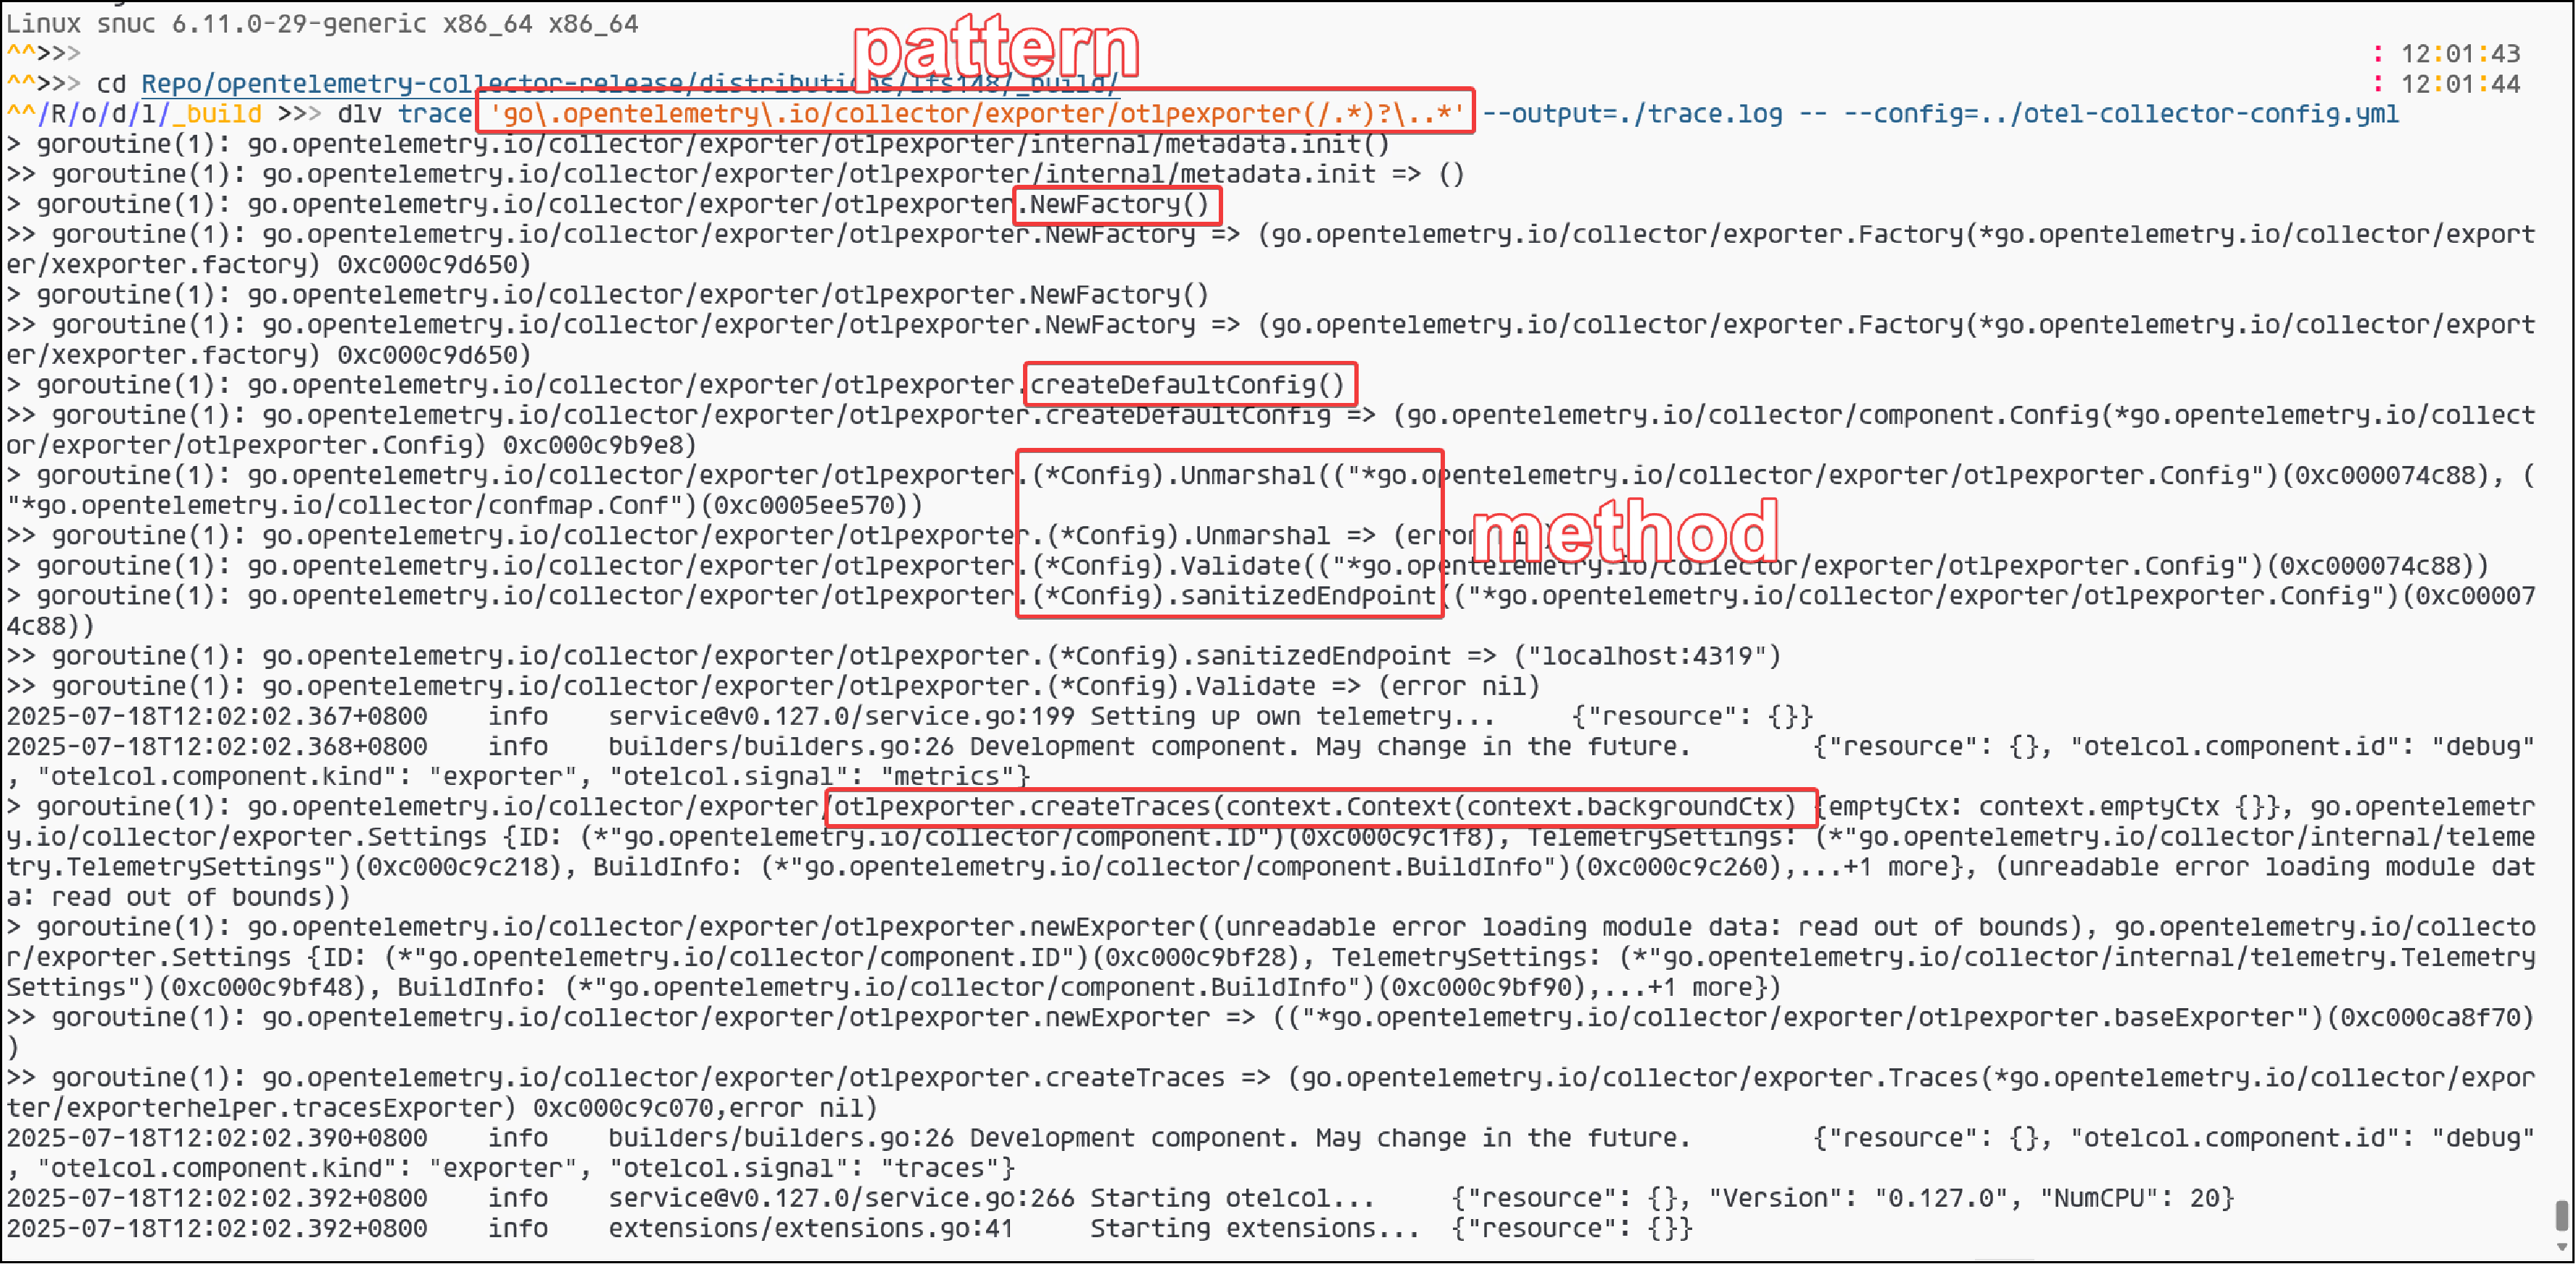 With that, I saw the first line of code executed in the component, and could set the breakpoint.
 Additionally, the call stack quickly revealed the function call chain. 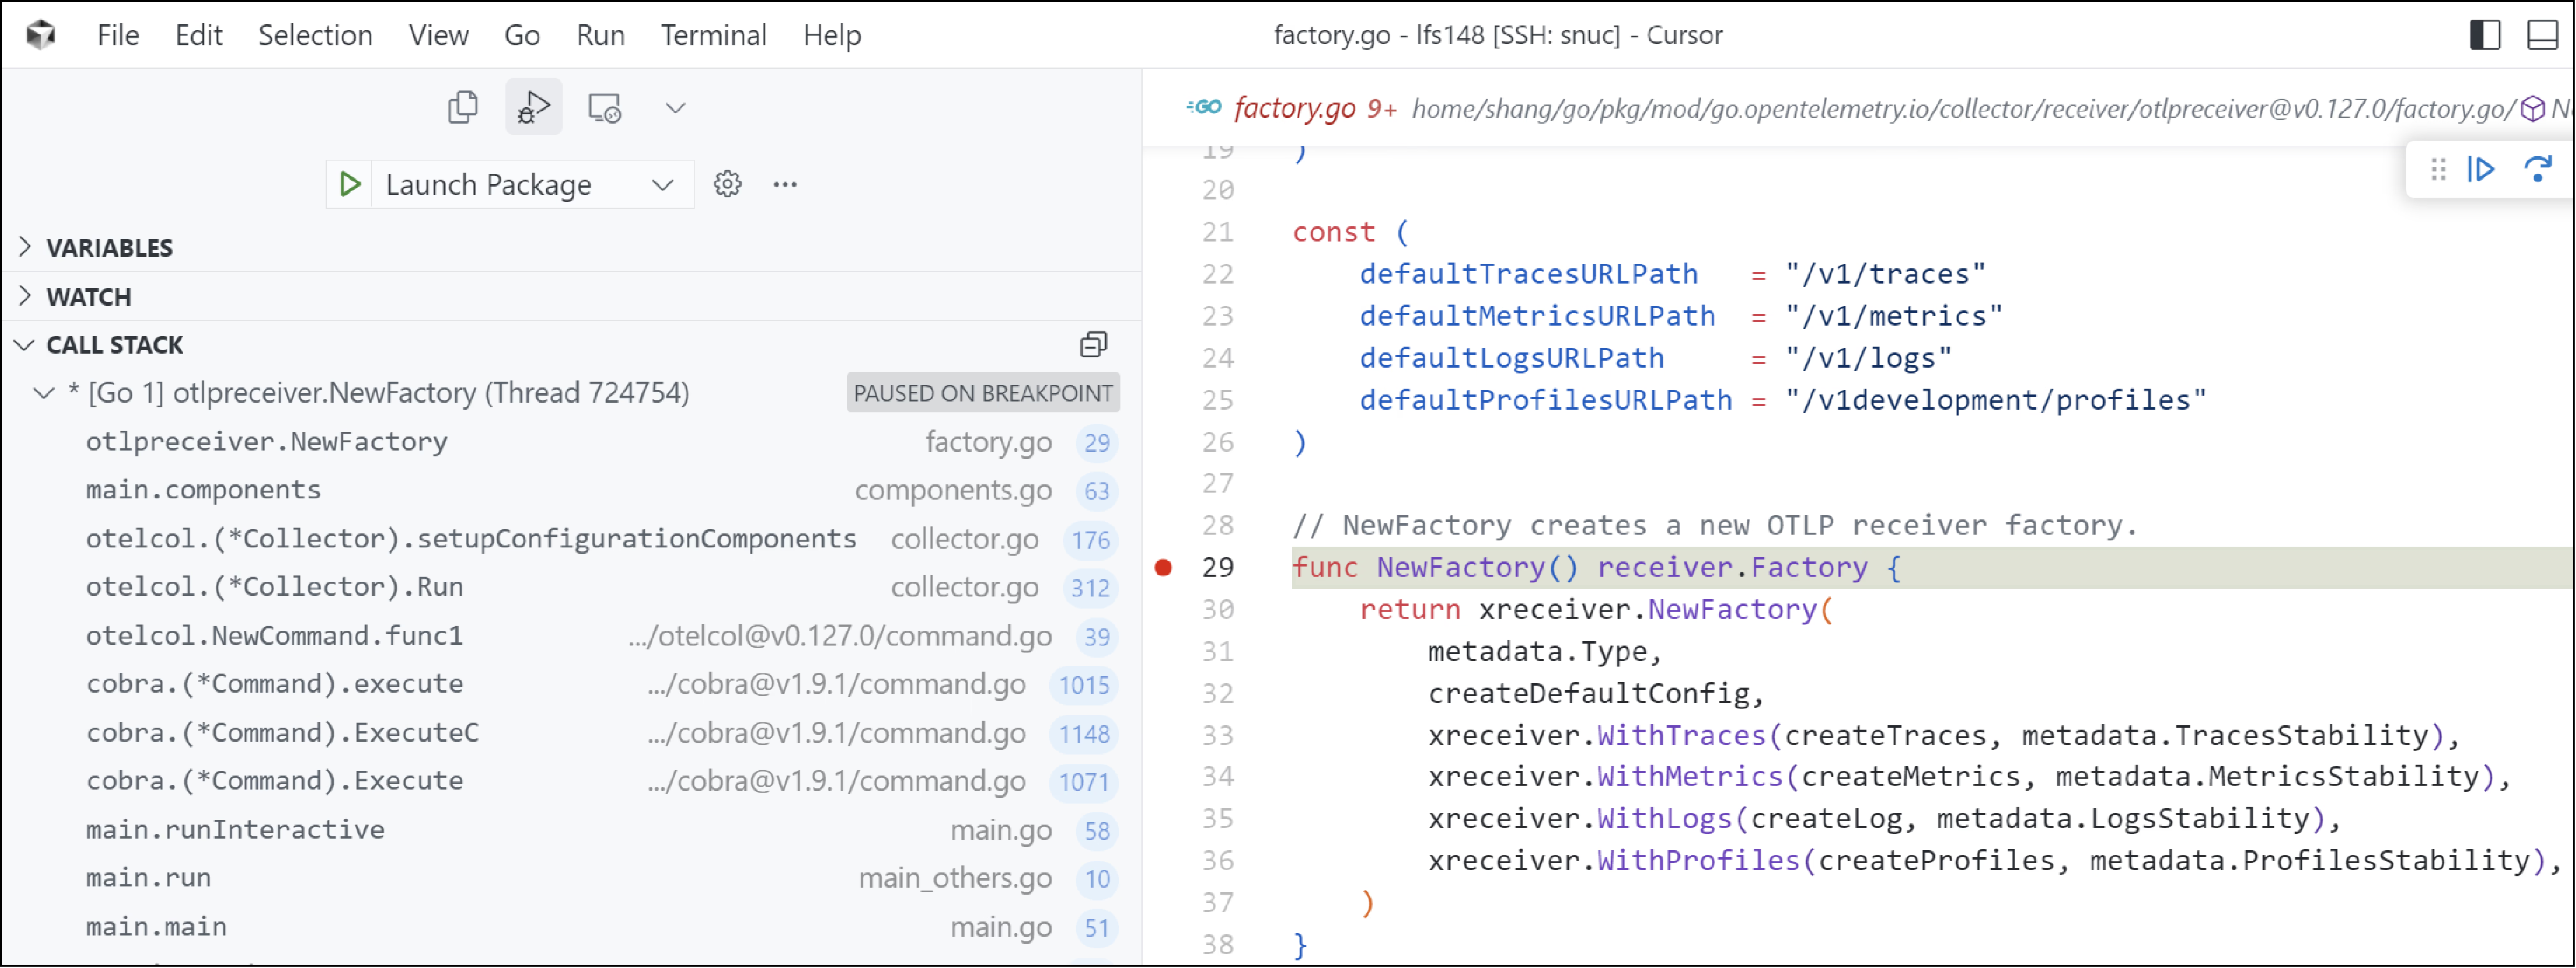
Data Flow
The OTel Collector has three key components: Receiver, Processor, and Exporter. Telemetry signals are received by the Receiver, converted to an internal data format (pipeline data) via the pdata module, optionally preprocessed (e.g., filtered) by the Processor, and then converted to the target format before being sent by the Exporter to the observability backend (e.g., Prometheus, Jaeger). 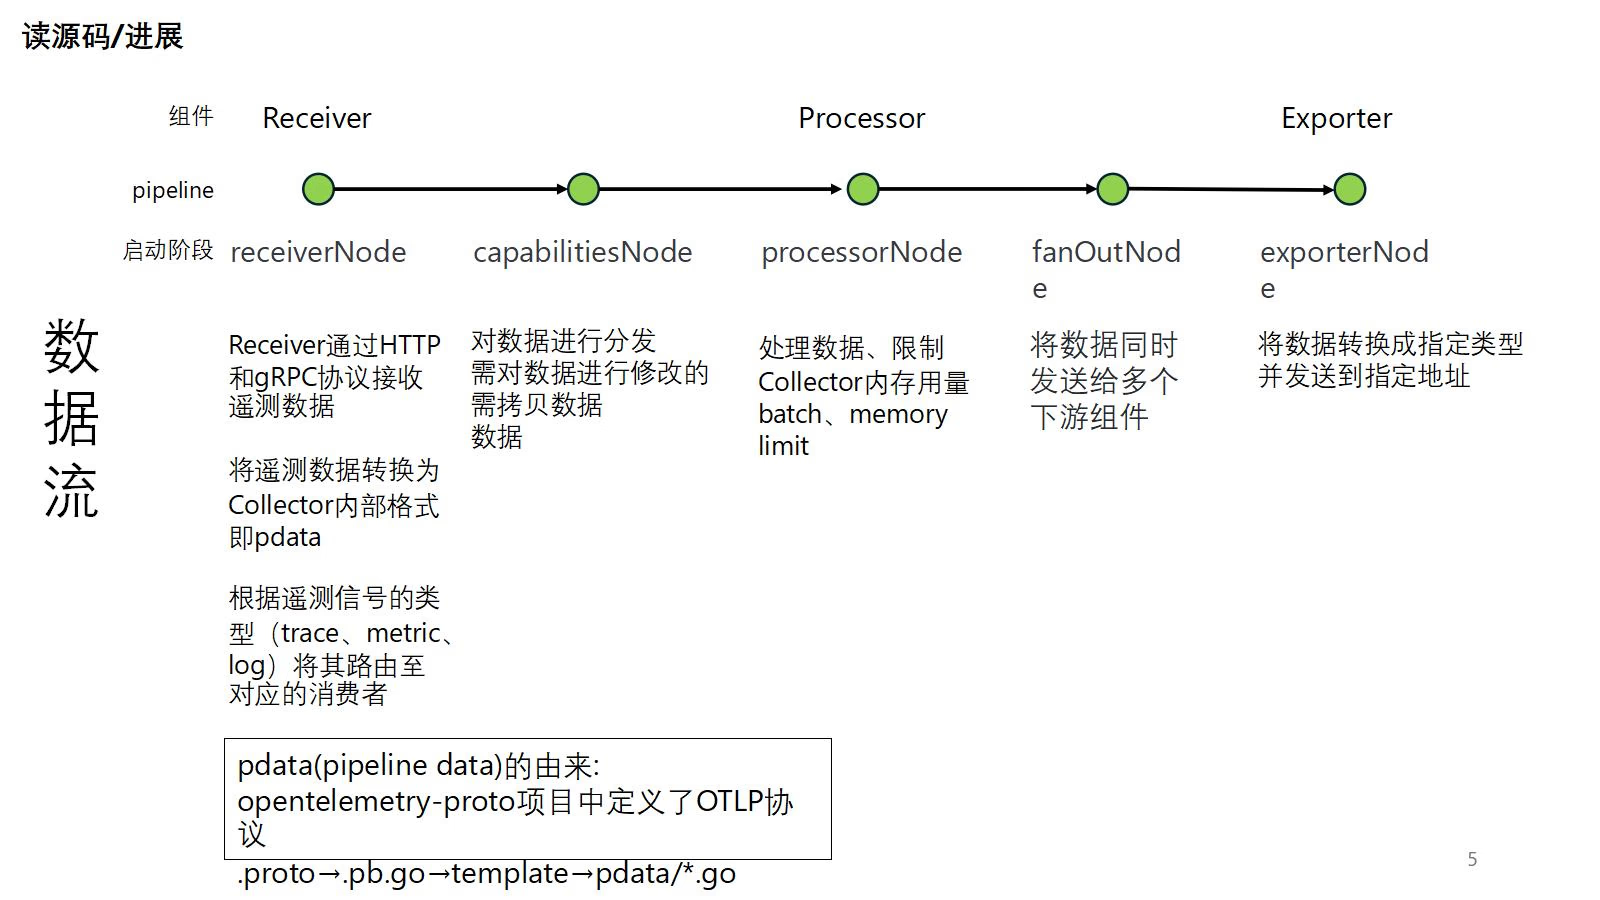
pdata: The Most Critical Module in the Collector
The pdata module in the OpenTelemetry Collector (opentelemetry-collector/pdata) stands for pipeline data. The OtlpReceiver component calls the pdata module to parse incoming OTLP telemetry signals into an internal representation. Different Receiver components can receive different signals, but they all must be converted to the internal representation for subsequent processing. 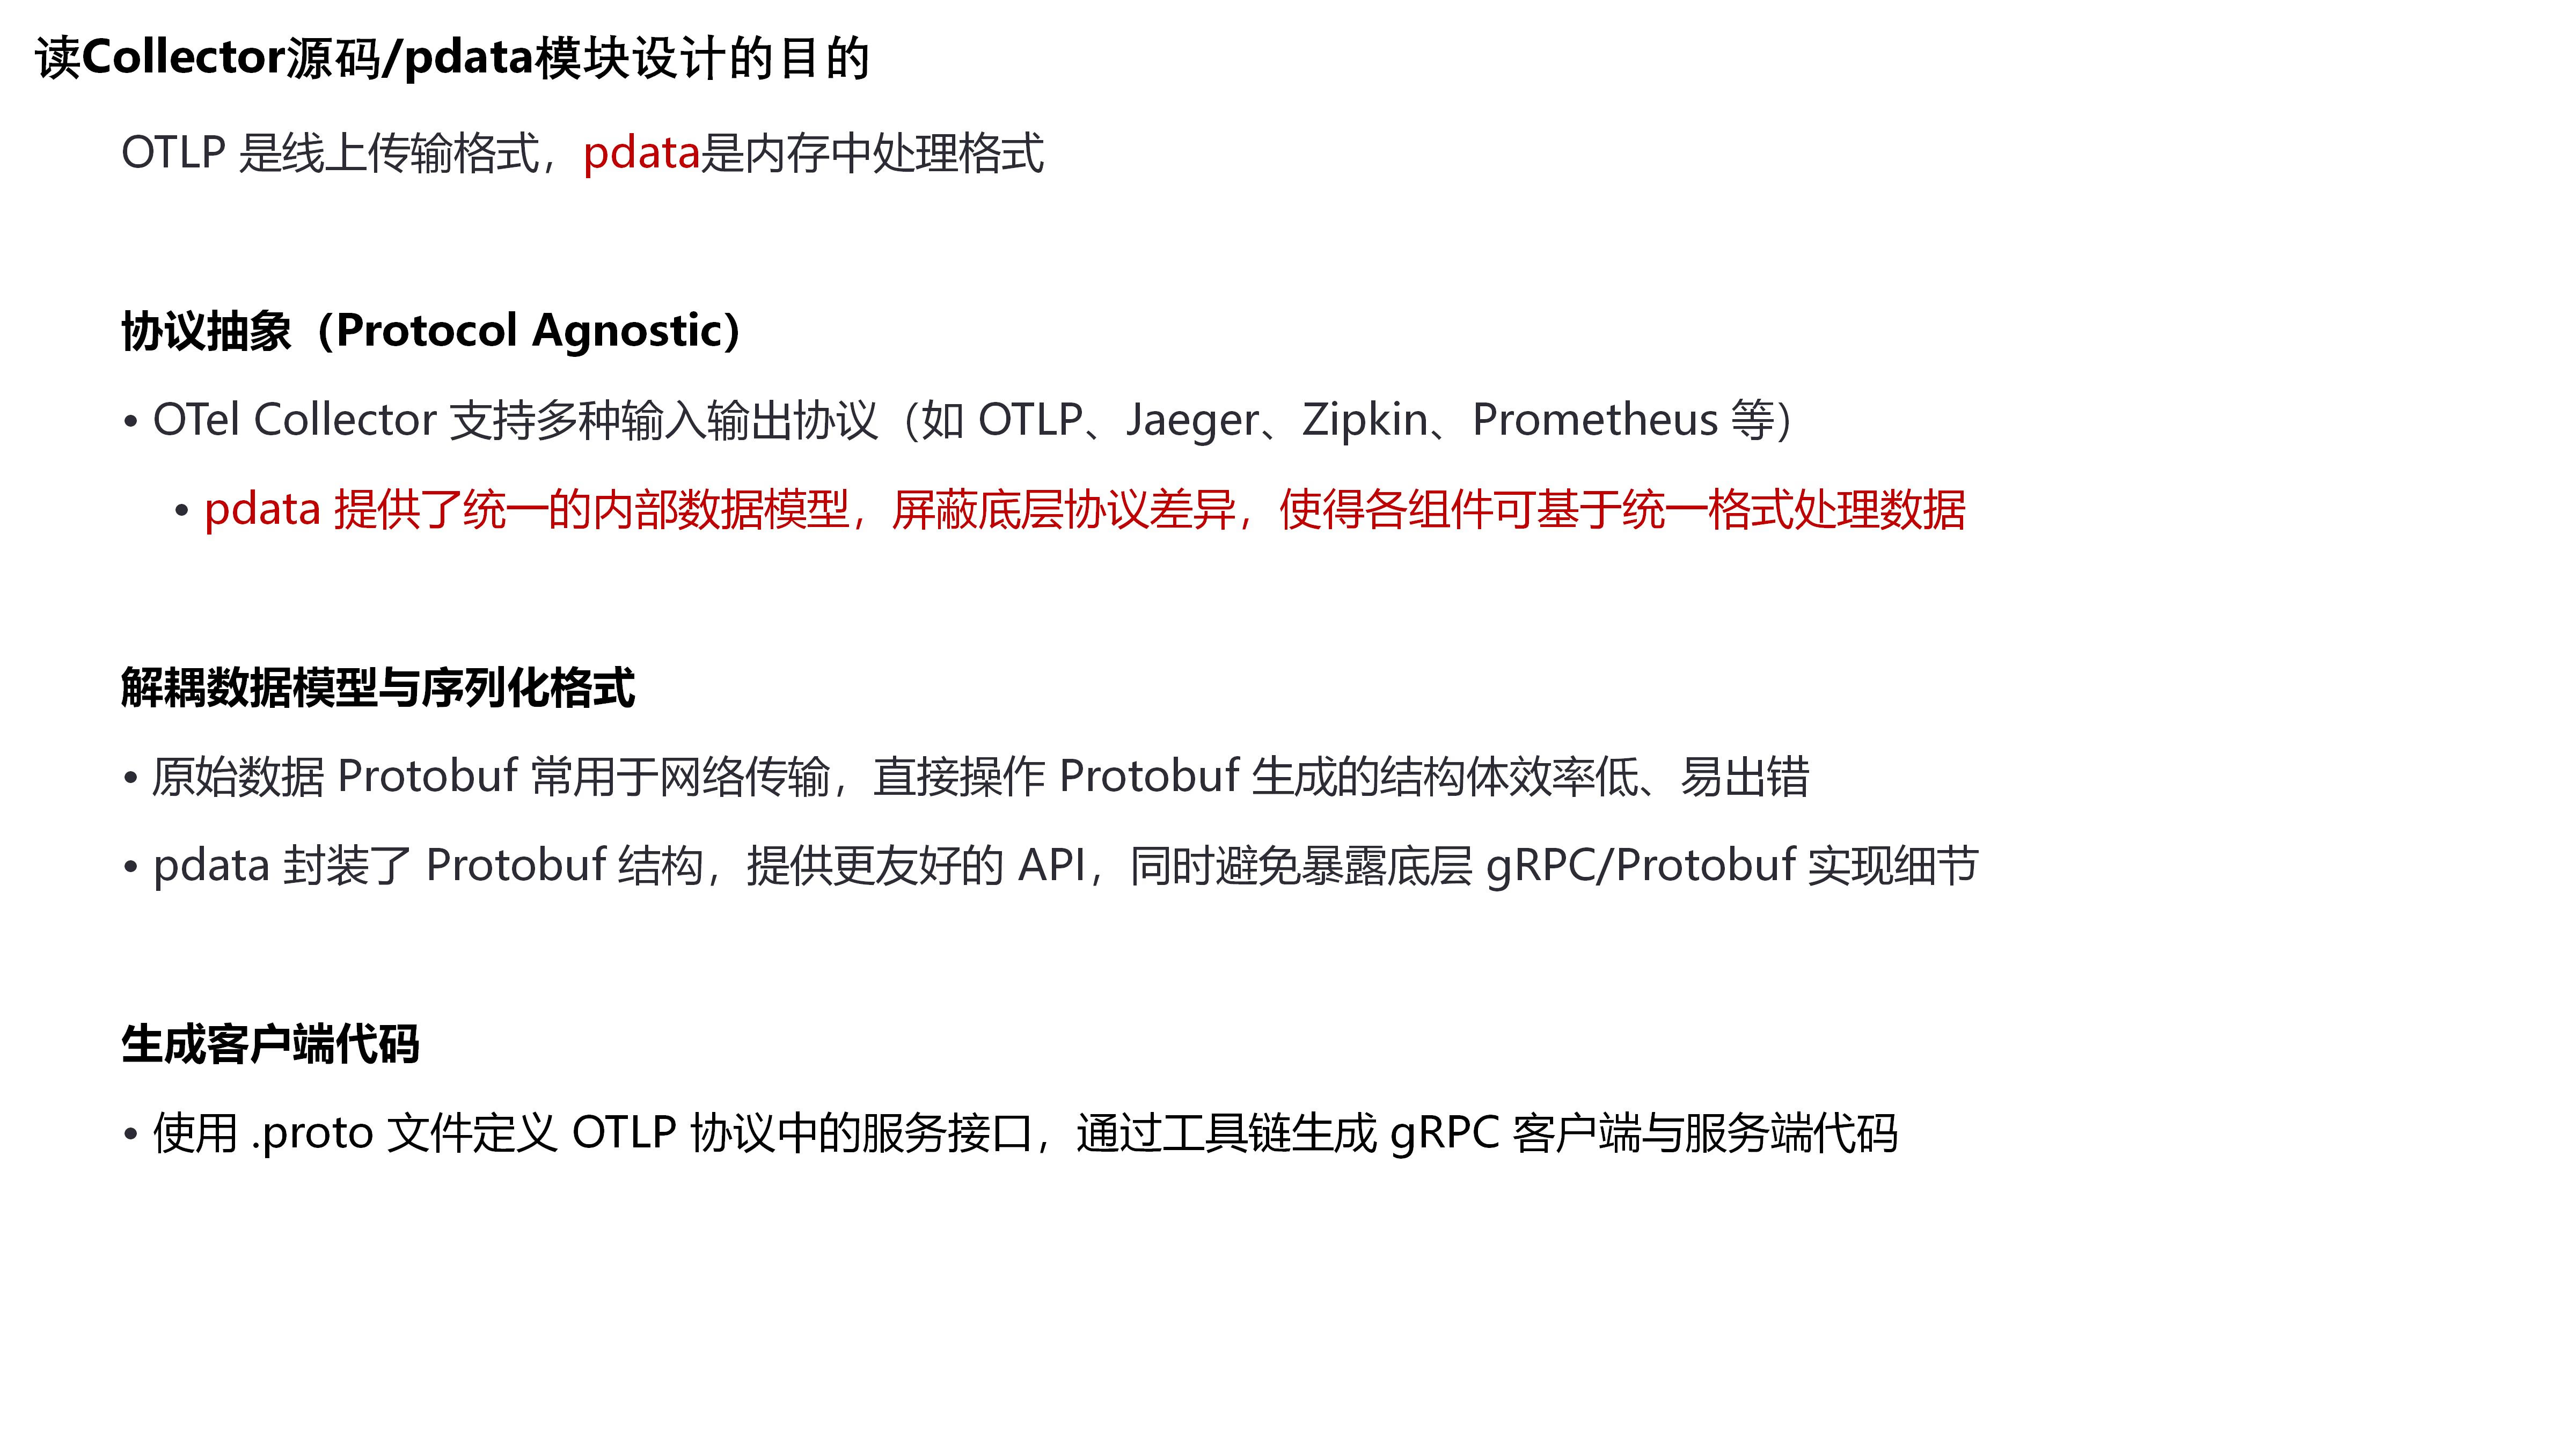
Exploring Development Based on Existing Open Source Projects
After searching, I found an OpenTelemetry project called otel-arrow, which aims to send OpenTelemetry data using the Apache Arrow protocol. Under otel-arrow, there’s a Rust project called Beaubourg that provides a library for building pipeline systems. Initially, I thought I could build on top of it, so I emailed the project author. They replied that I would need to implement OtlpReceiver, OtlpExporter, and BatchProcessor myself.
But I found some points that ultimately made me abandon this approach:
- The most important pdata module was not implemented.
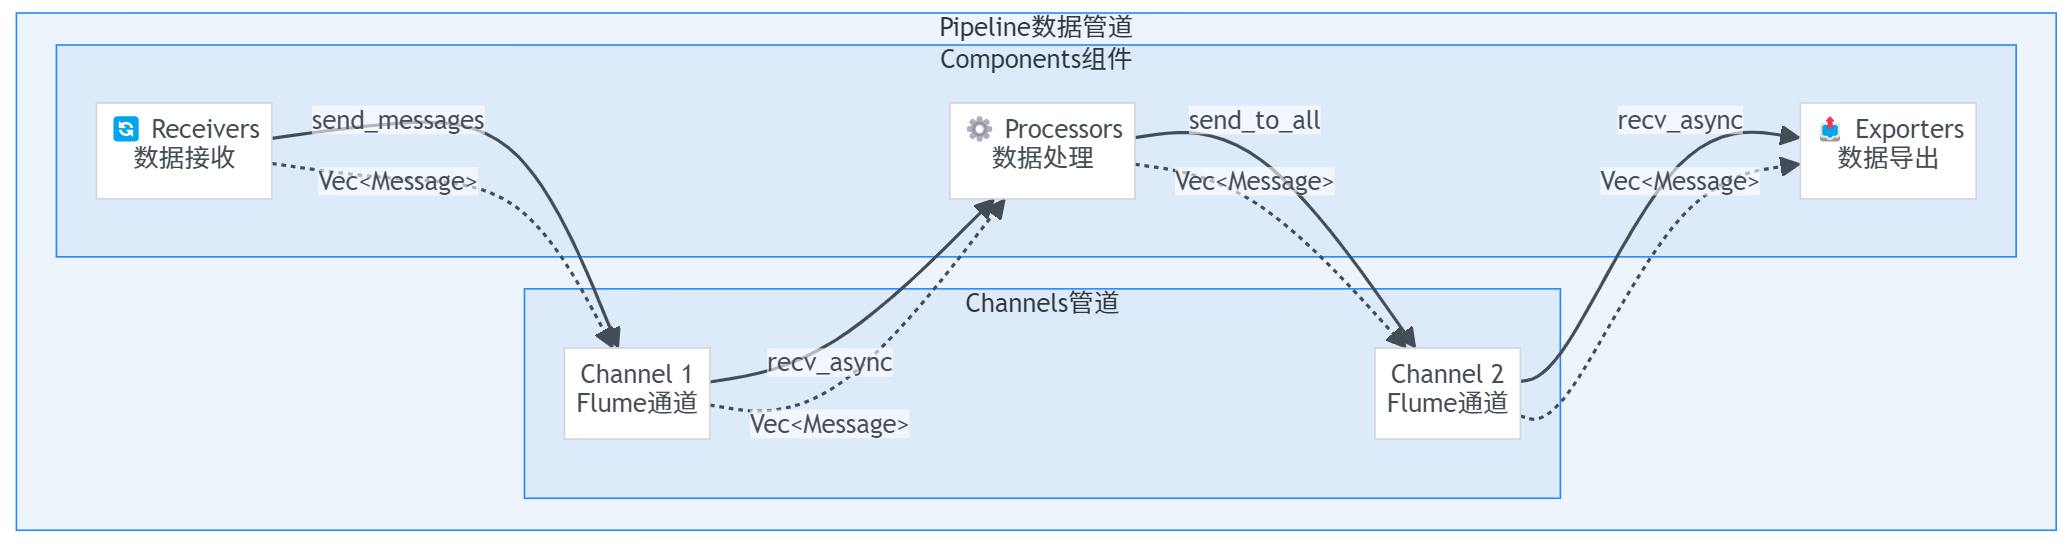
- Beaubourg passes data between components via Flume Channel, while the official implementation uses function calls.
OTLP protocol hierarchy: 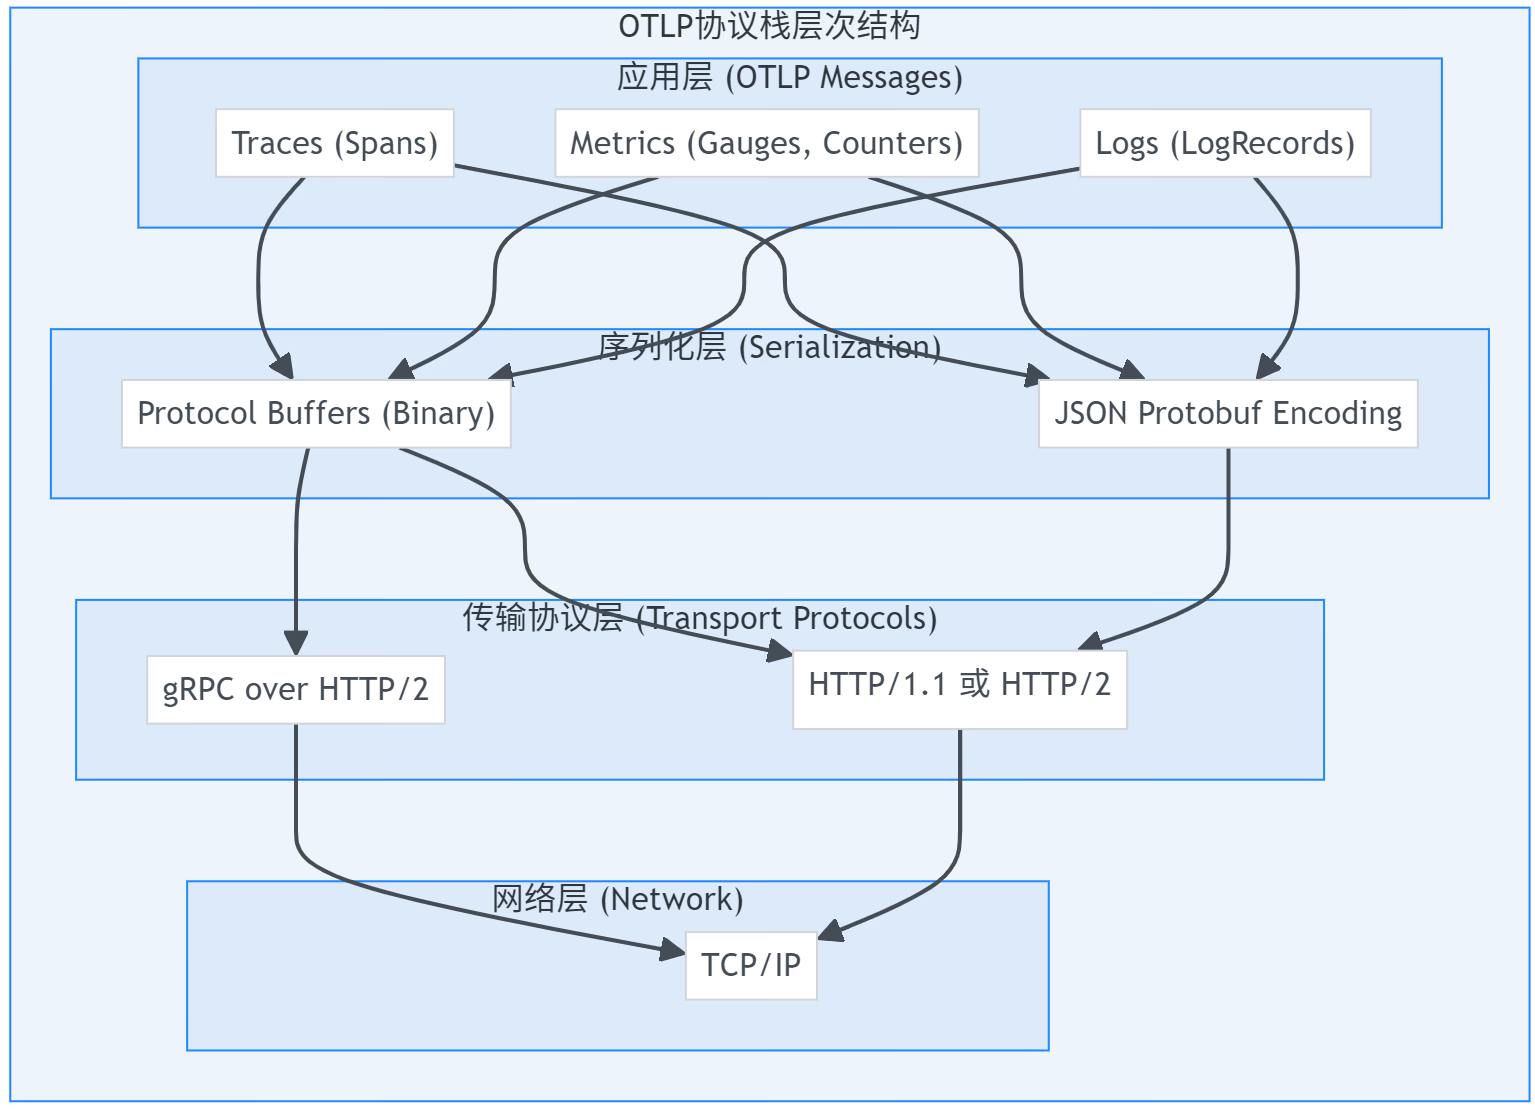
Complete OTLP data flow: 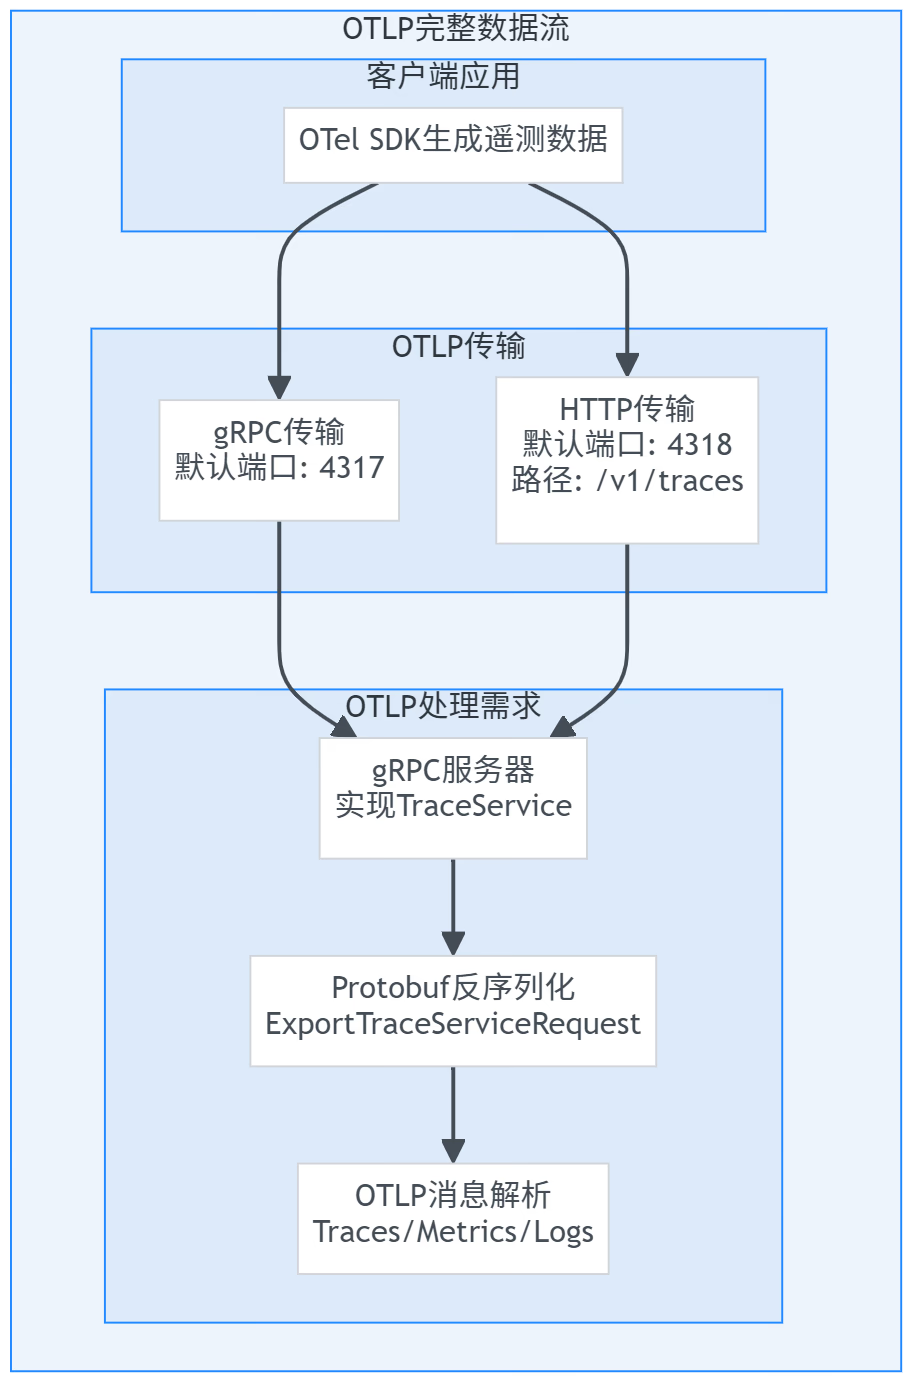
Consumer: Interface Abstraction Between Components
To allow users to freely assemble data processing pipelines as needed, the OTel Collector requires every component to implement the interfaces provided by the consumer module. This way, components pass data through interfaces, achieving decoupling. 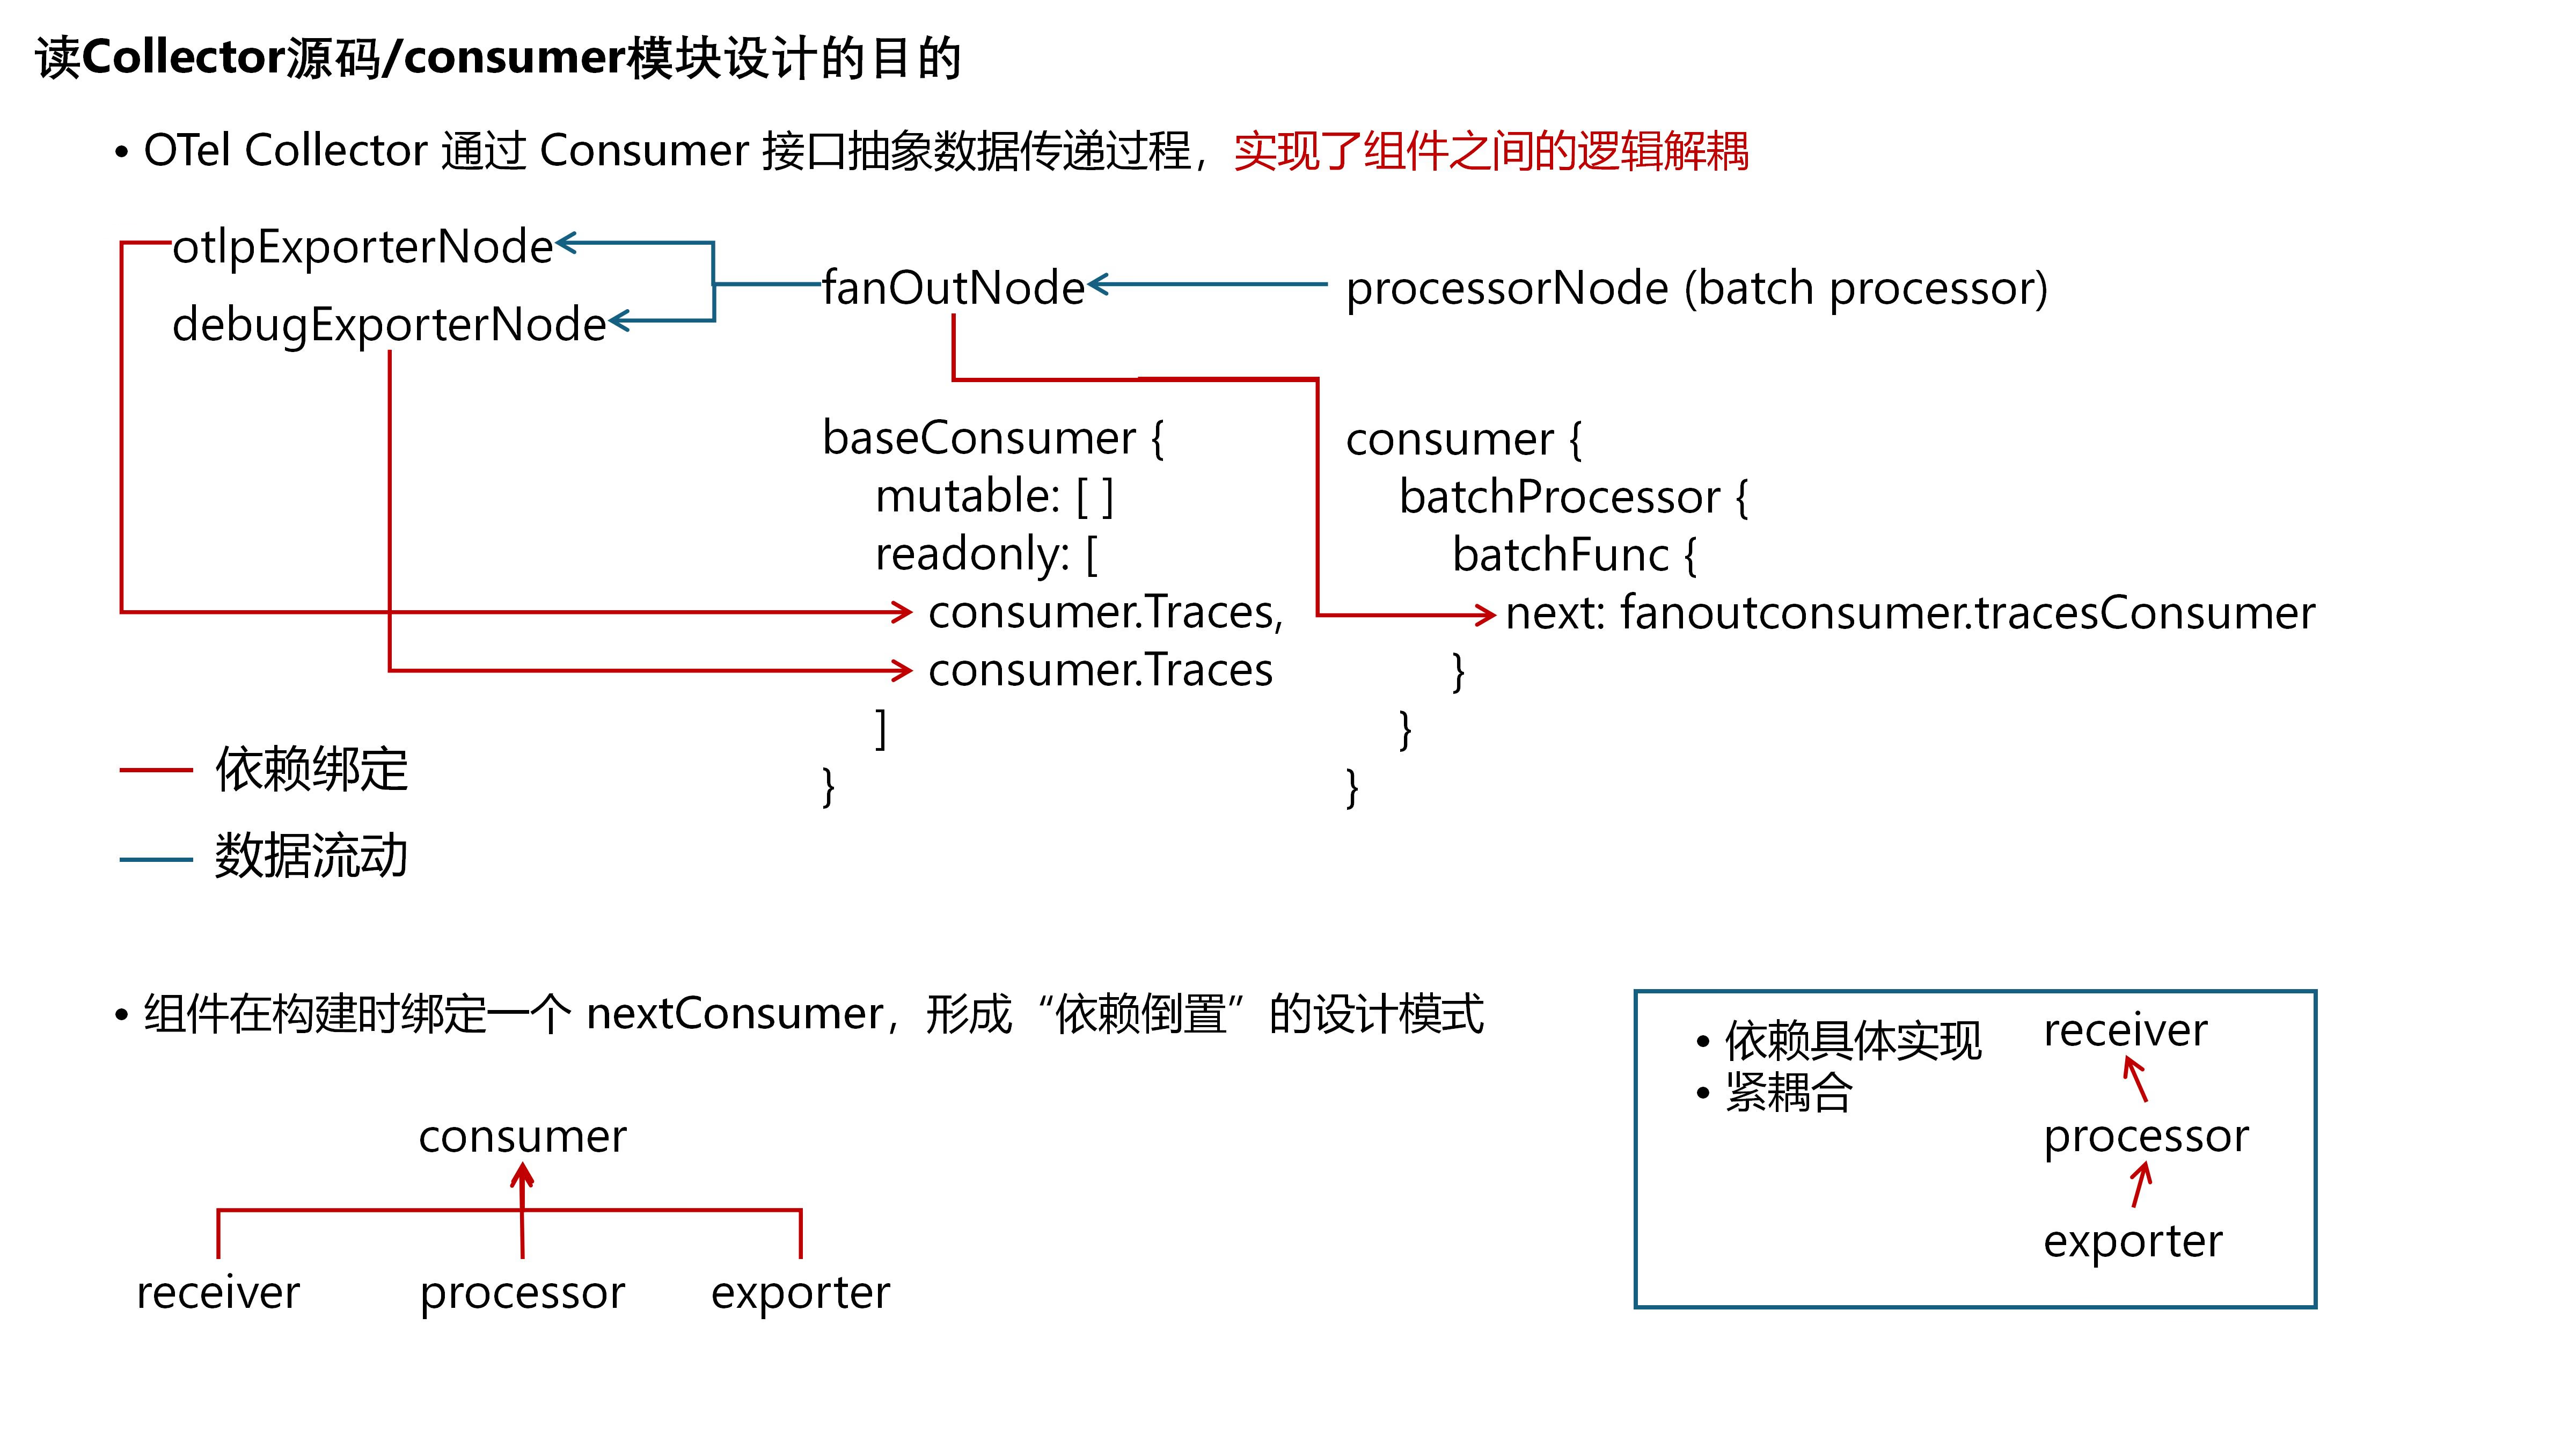
Receiver’s Use of the Pdata Module
The OtlpReceiver supports receiving OTLP telemetry data over HTTP or gRPC, then calls the pdata module for parsing. 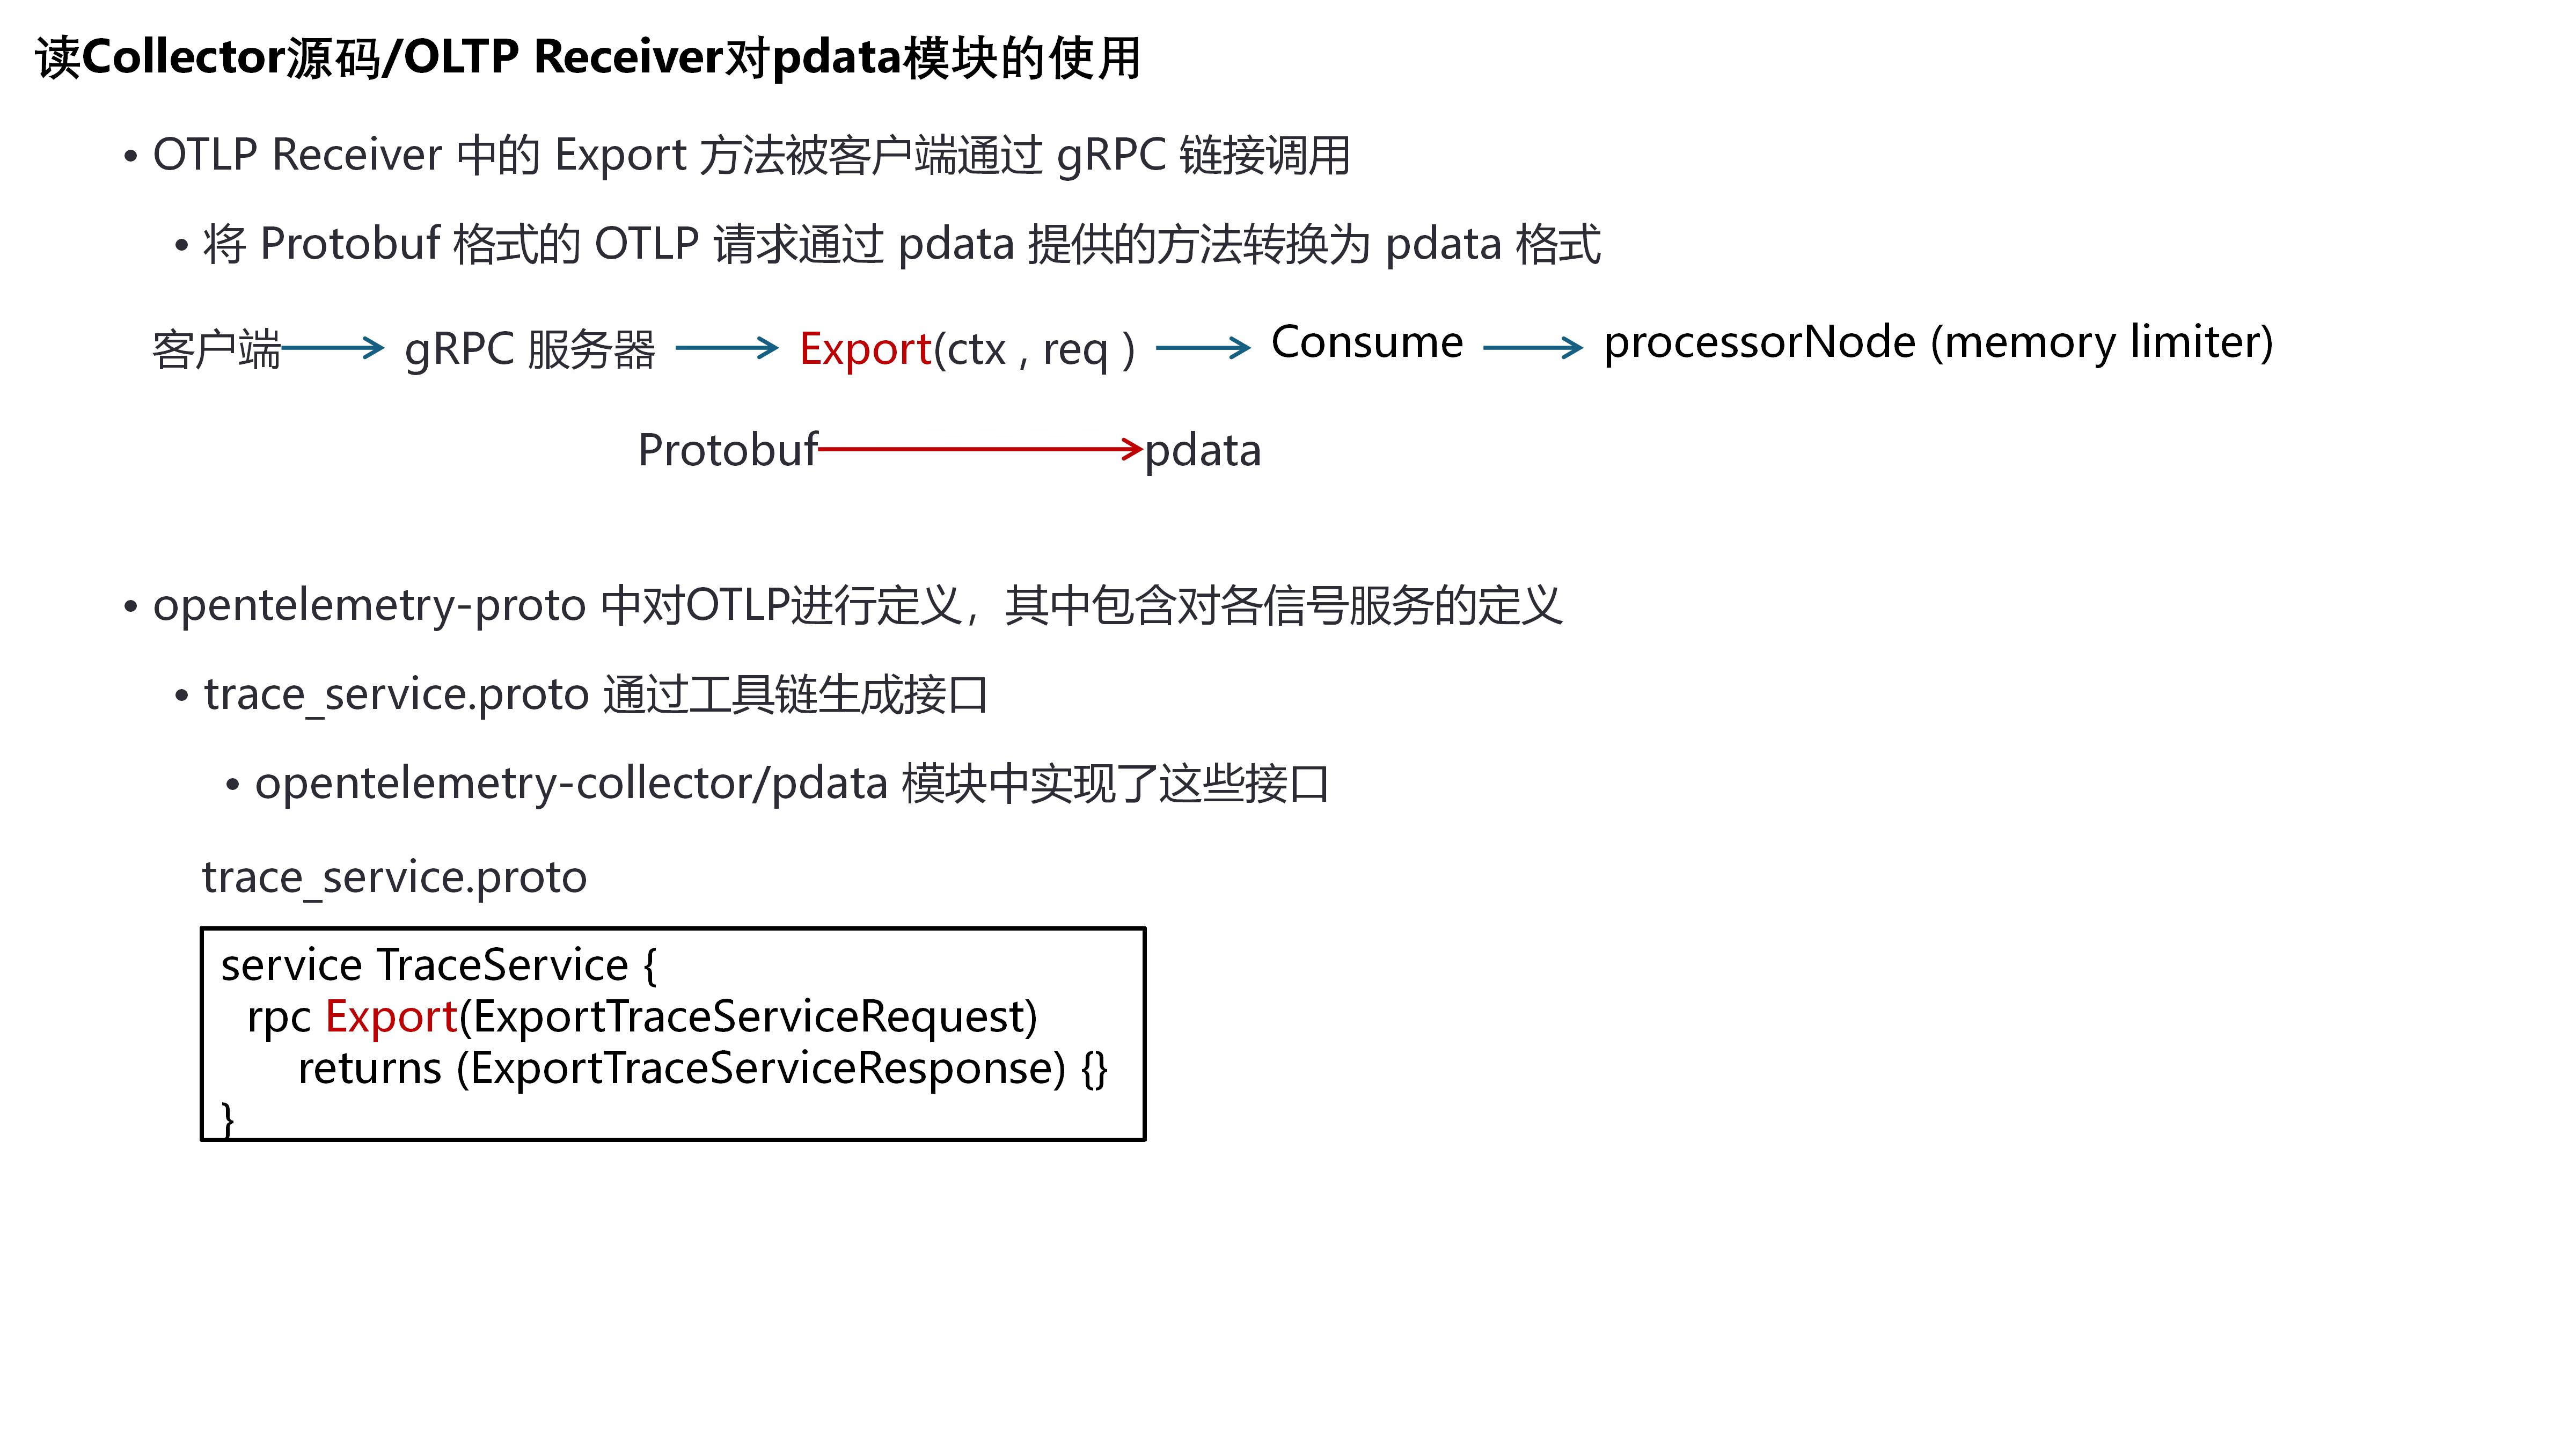
This slide shows the receiver calling pdata’s Export method to convert a Protobuf OTLP request into pdata format, then passing it to the next node via the consume interface.
Memory Limiter: Memory Usage Monitoring
The Collector caches received telemetry signals in an in-memory queue. For massive data volumes, Memory Limiter is used to monitor memory consumption. It periodically checks memory usage; when exceeding the limit, it sets a status flag called mustRefuse. The Receiver checks this flag before accepting new data — if set, it stops receiving and returns an error. This backpressure mechanism attributes the problem to the upstream data source, using protocol-level error codes to inform upstream clients to lower their send rate, thus regulating traffic. 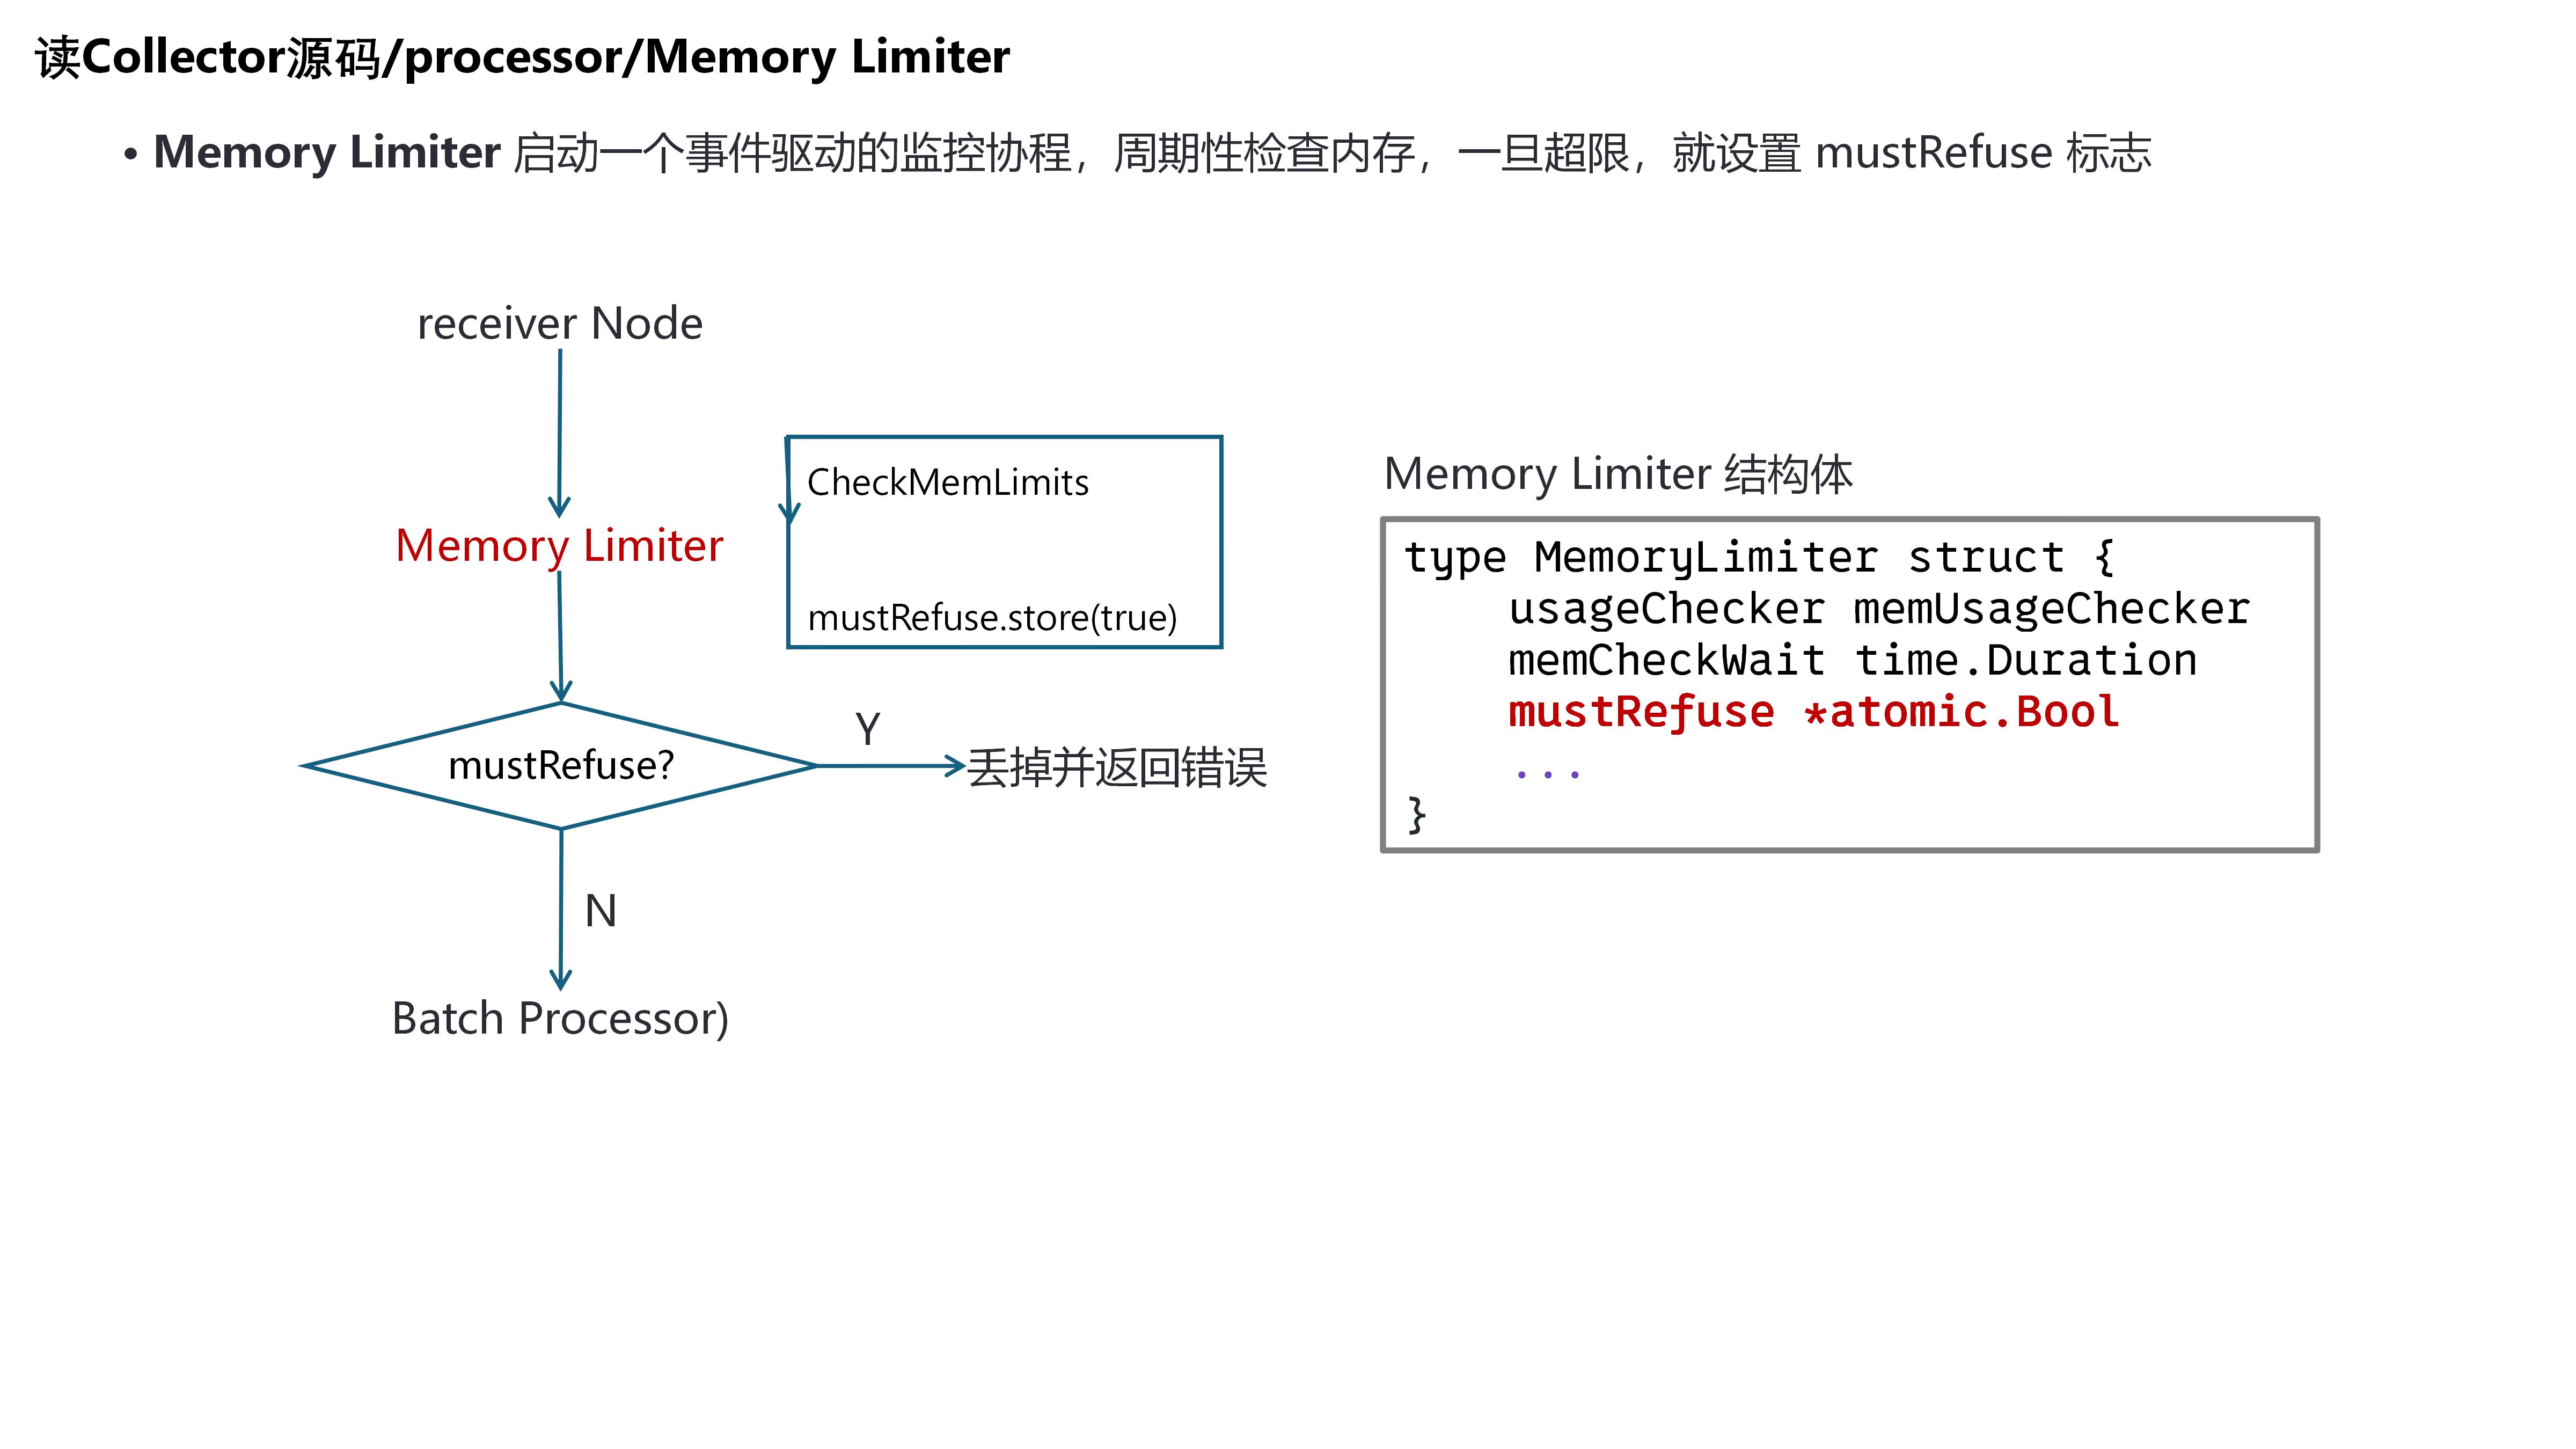
BatchProcessor: Batch Processing
The BatchProcessor receives data from upstream via the consumer interface, accumulates it into batches, and once the specified batch size is reached, sends it to the downstream consumer. 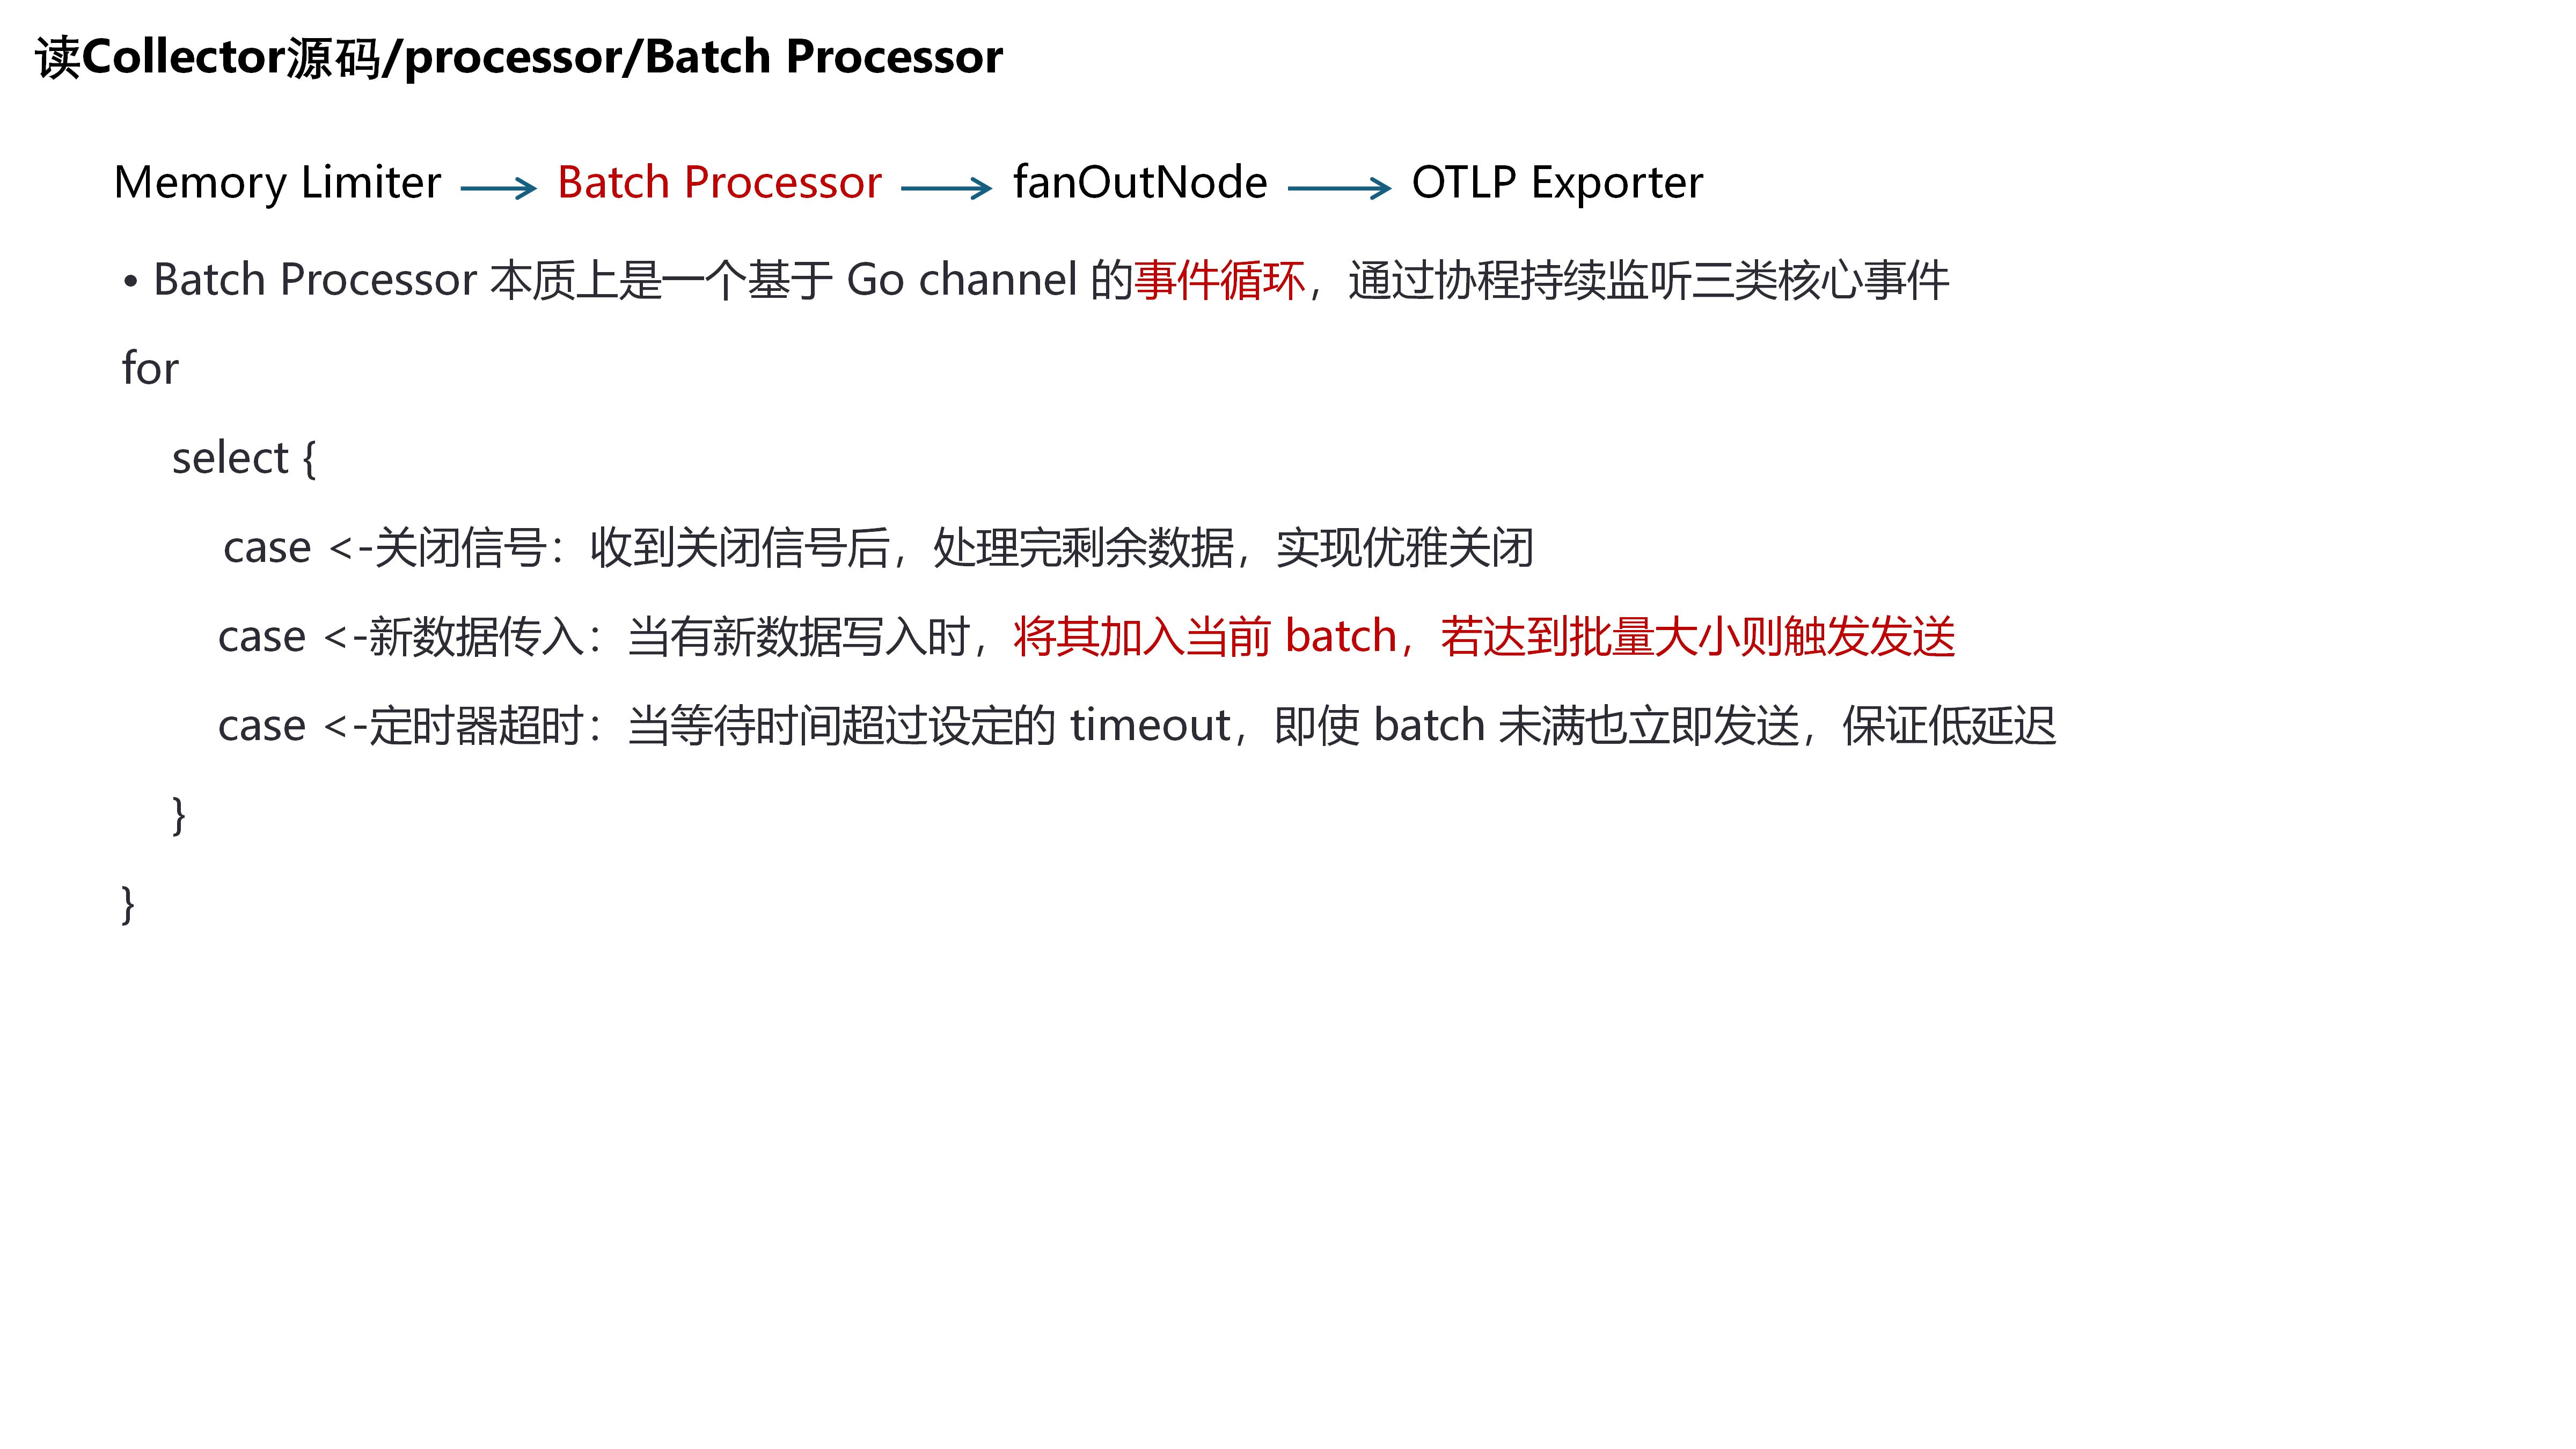
Exporter’s Use of the Pdata Module
The OtlpExporter uses methods provided by pdata to convert telemetry data from the internal format to Protobuf format, then sends it via HTTP or gRPC. 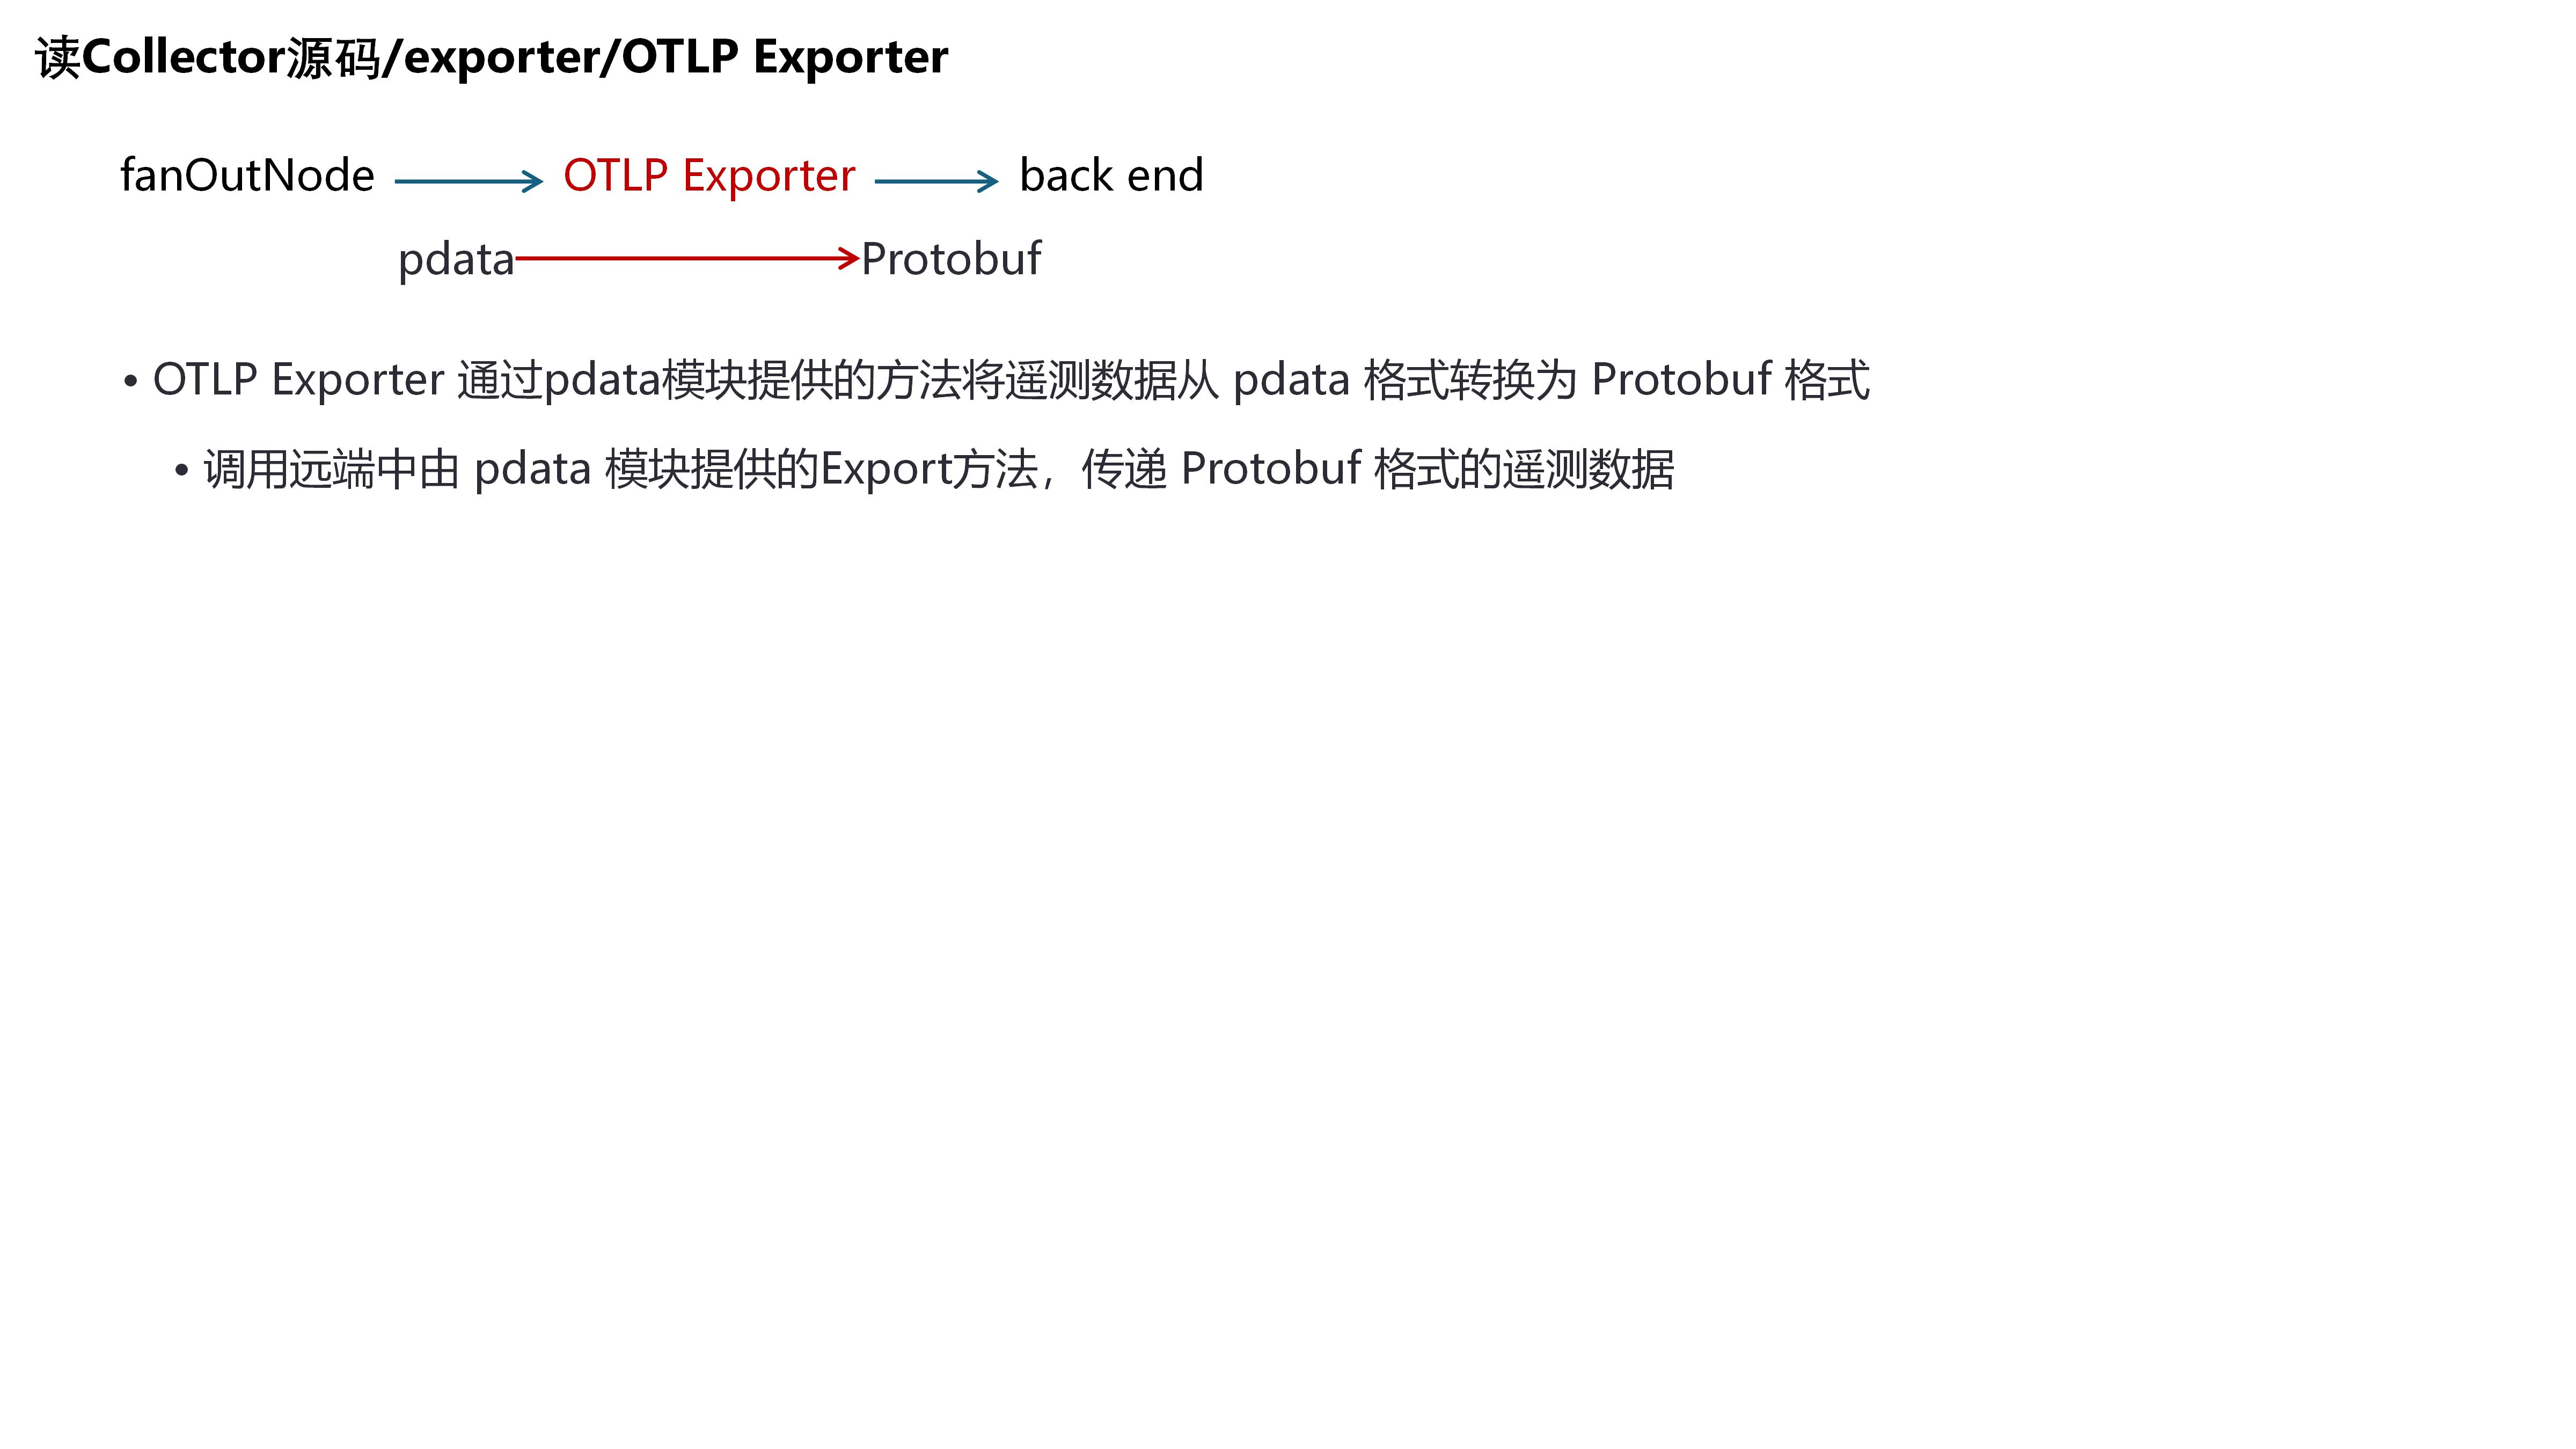
Implementation
pdata
The official pdata module implementation consists of several phases:
- Phase 1: Compile the OTLP protocol defined in opentelemetry-proto using Protobuf into .pb.go code via a toolchain.
- Phase 2: Write base structs (e.g.,
base_*.go) and code generation methods incmd/pdatagen/internal. Configure generation info for each package (e.g.,p*_package.go). It’s worth explaining:p*_package.gocontains declarative configurations for code generation, using base types defined inbase_*.goto describe the OTLP protocol. When main.go runs, it iterates through each defined package, and each struct in each package uses corresponding methods and templates (templates/*.go.tmpl) to generate code.
Implementing Phase 1 in Rust was straightforward: I used the tonic-prost-build library to compile the Protobuf-defined OTLP protocol into Rust code, with output paths exactly replicating the official design, as shown. 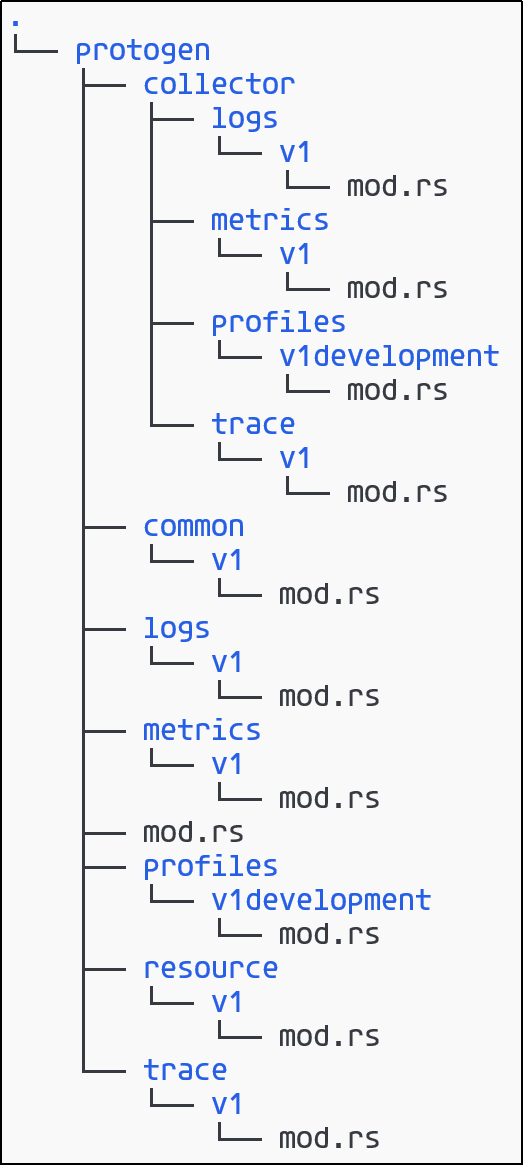
Phase 2 encountered issues. In the official implementation, base_fields.go contains many accessor methods (getters) for different struct types, relying on Go’s text/template feature. After a day of trying, I found it difficult to achieve the same effect in Rust.
While discussing with Qwen, I realized that the generated Rust code already uses derive macros to implement accessor methods for structs. This proved that I should fully leverage the language’s own features, rather than simulating one language’s features in another.
Generated Rust code from the protocol:
// This file is @generated by prost-build.
#[derive(Clone, PartialEq, ::prost::Message)]
pub struct ExportTraceServiceRequest {
    #[prost(message, repeated, tag = "1")]
    pub resource_spans: ::prost::alloc::vec::Vec<
        super::super::super::trace::v1::ResourceSpans,
    >,
}
I discovered that the protocol also defines services, making it easy to generate code for services, clients, servers, and request/response implementations. opentelemetry-proto/opentelemetry/proto/collector/trace/v1/trace_service.proto:
syntax = "proto3";
package opentelemetry.proto.collector.trace.v1;
import "opentelemetry/proto/trace/v1/trace.proto";

service TraceService {
  rpc Export(ExportTraceServiceRequest) returns (ExportTraceServiceResponse) {}
}

message ExportTraceServiceRequest {
  repeated opentelemetry.proto.trace.v1.ResourceSpans resource_spans = 1;
}

message ExportTraceServiceResponse {
  ExportTracePartialSuccess partial_success = 1;
}

message ExportTracePartialSuccess {
  int64 rejected_spans = 1;
  string error_message = 2;
}
OtlpReceiver: 🪄 AI Programming – My “Aha Moment”
During this project, I moved three times — a real mental drain. Perhaps because things were so grim, even small progress felt brilliant.
After the second move, I teamed up with Qwen, Cursor (Claude) to complete the task of generating pdata code from opentelemetry-proto.
The Aha moment happened at NBS Library. I sat by the window and asked Cursor to help me implement OtlpReceiver and use pdata for parsing. 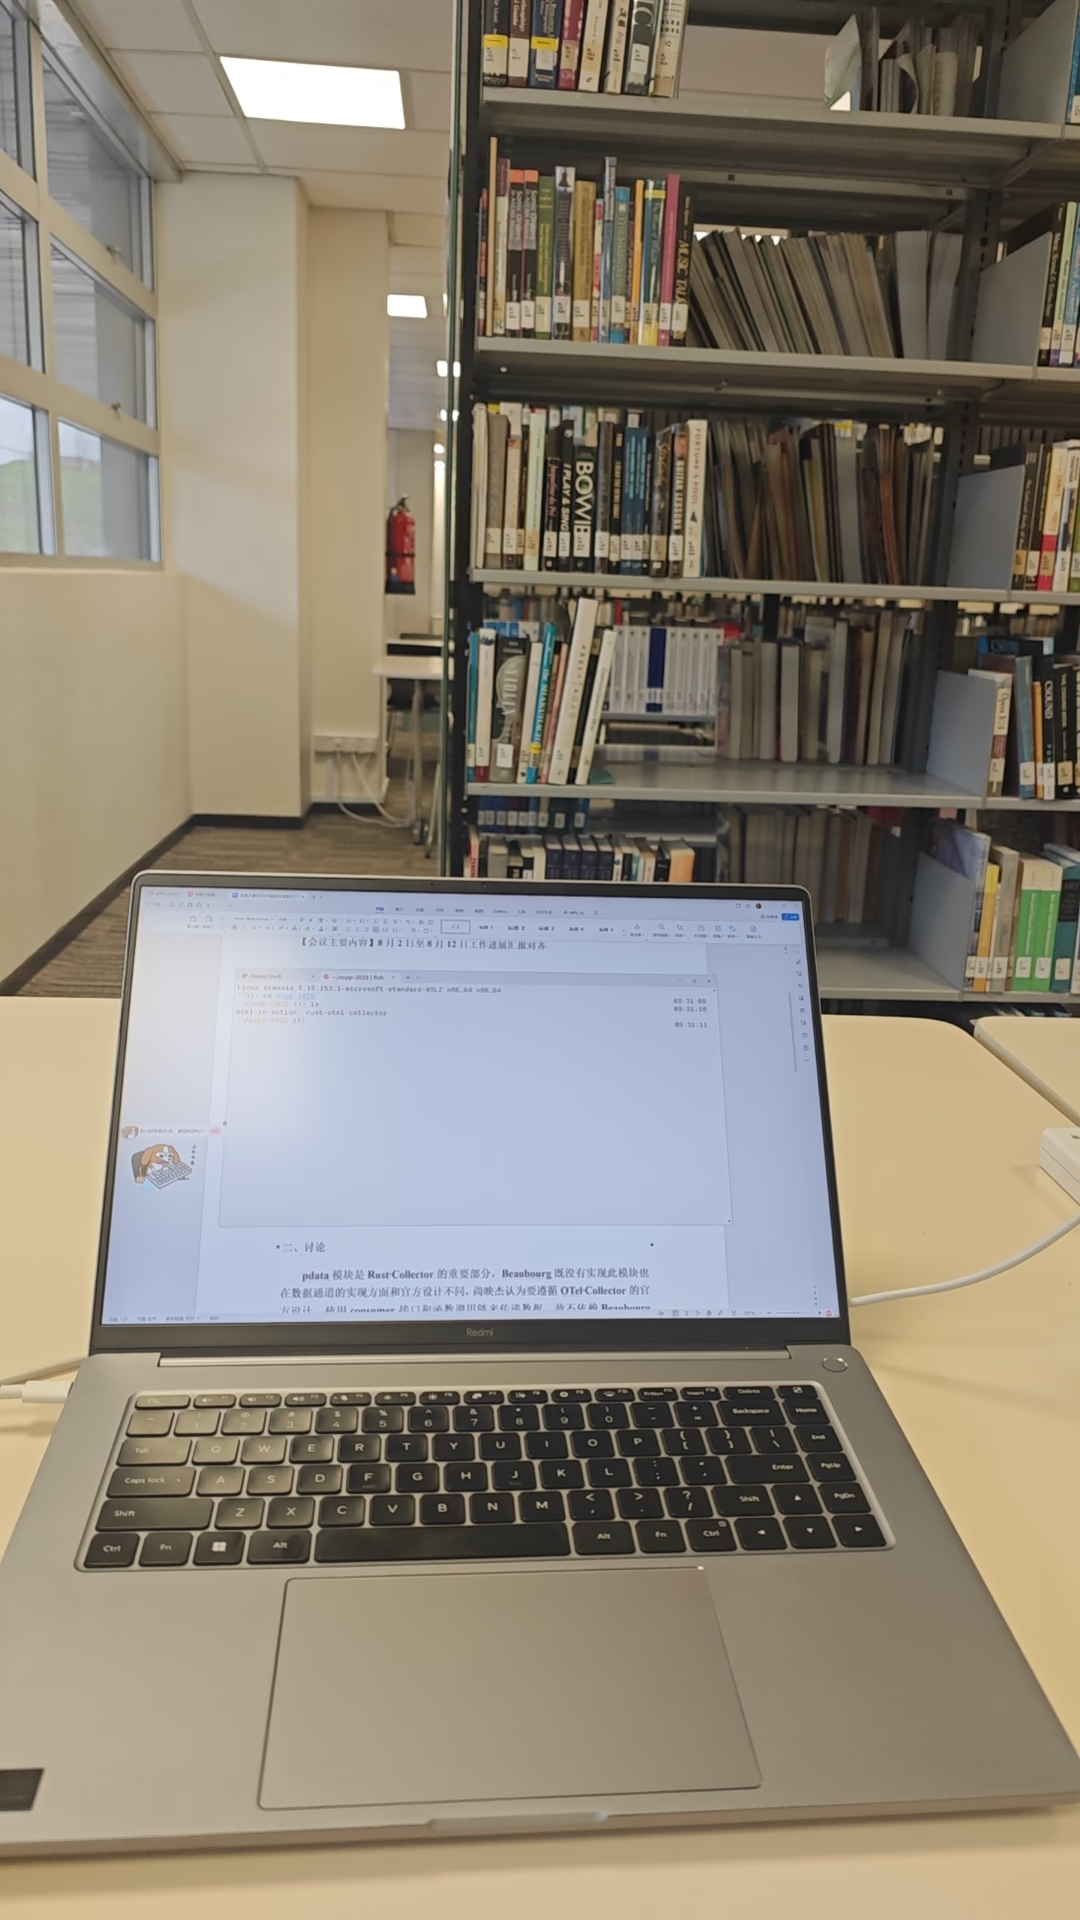 Minutes later, Cursor said the test passed! It could correctly receive and parse OTLP signals. I didn’t believe it at first, so I asked it to write a DebugExporter to print the received telemetry. A few more minutes, and Cursor notified me again. I enlarged the VSCode Terminal Output and looked carefully — there it was! The structs printed out, exactly the pdata structs.
At that moment, I truly felt this project would succeed.
Later, I moved a third time. There, I finished the remaining tasks. 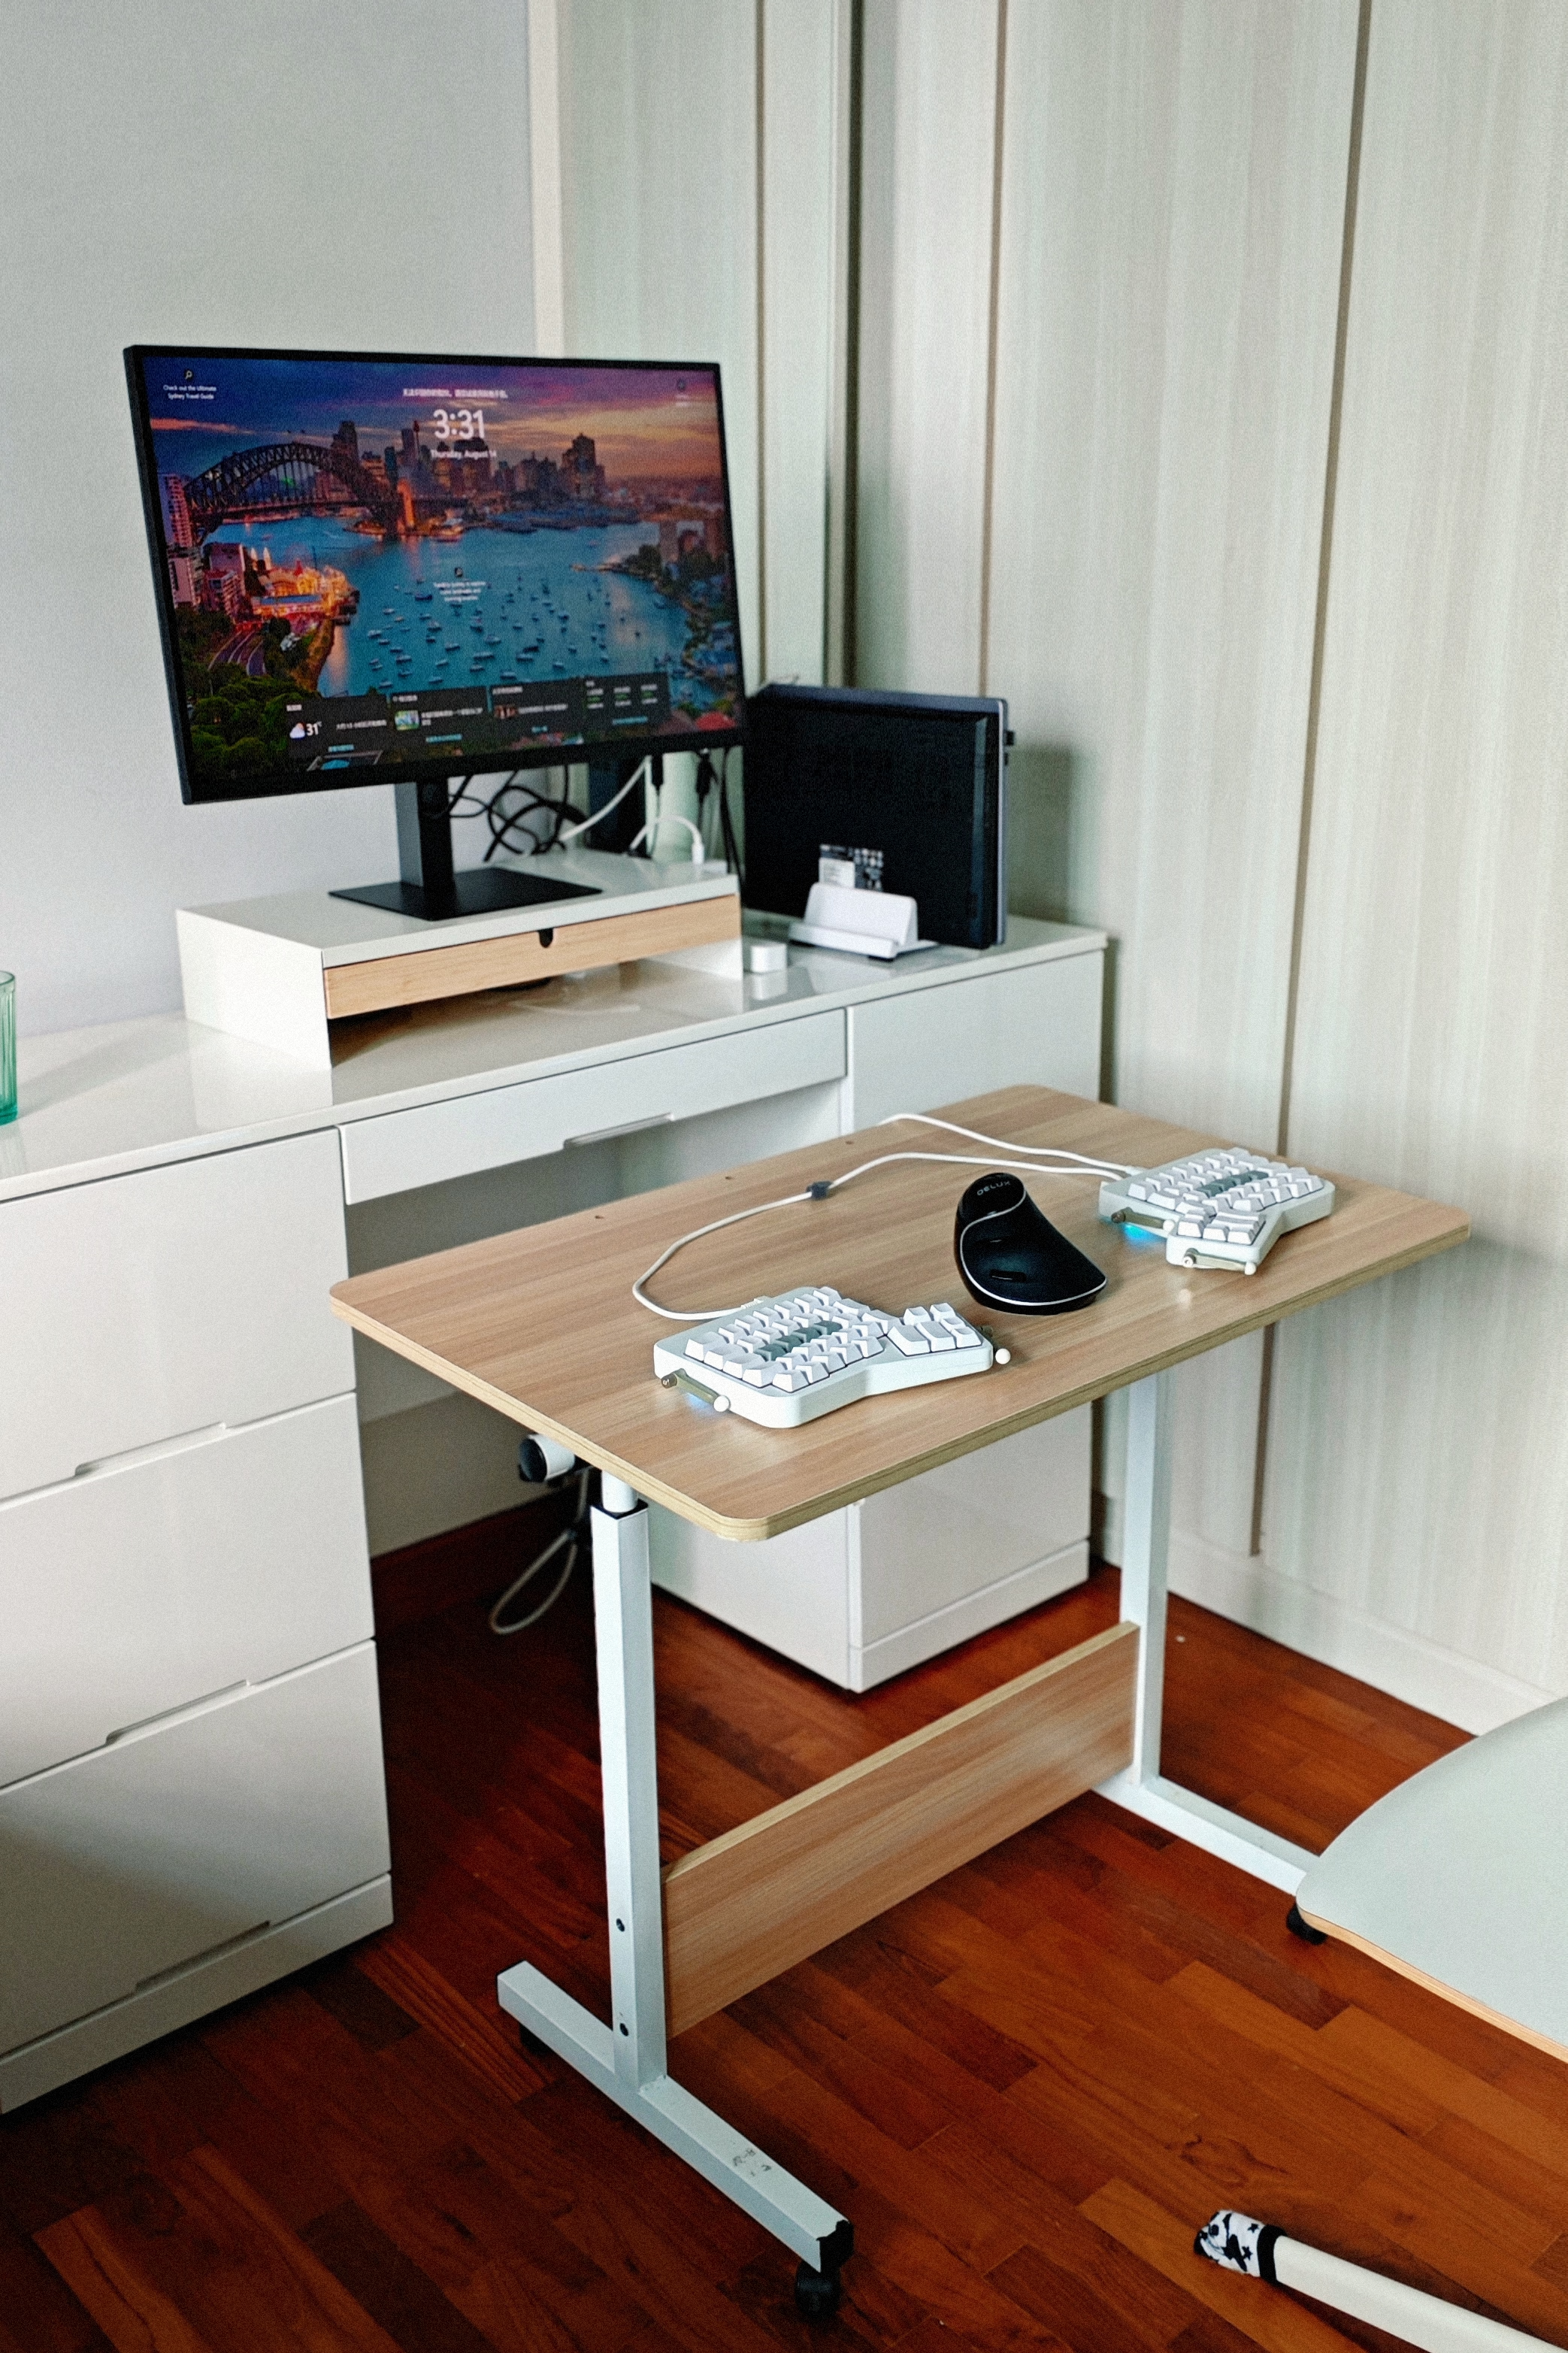
I suspect Qwen’s training data or knowledge base includes Alibaba team’s notes on OpenTelemetry, because many points were only known through dynamic debugging.
Demo Verification Environment
I studied the OpenTelemetry course on LF Training Platform and used the lab environment (deployed with two front-end services, one back-end service, Jaeger, and Prometheus) to verify my Collector.
There are three types of telemetry signals:
- Metrics
- Traces (can form the complete flow of a request across services)
- Logs
After implementing OtlpExporter, I replaced the OTel Collector with my Rust Collector, and got the same results in Jaeger and Prometheus:
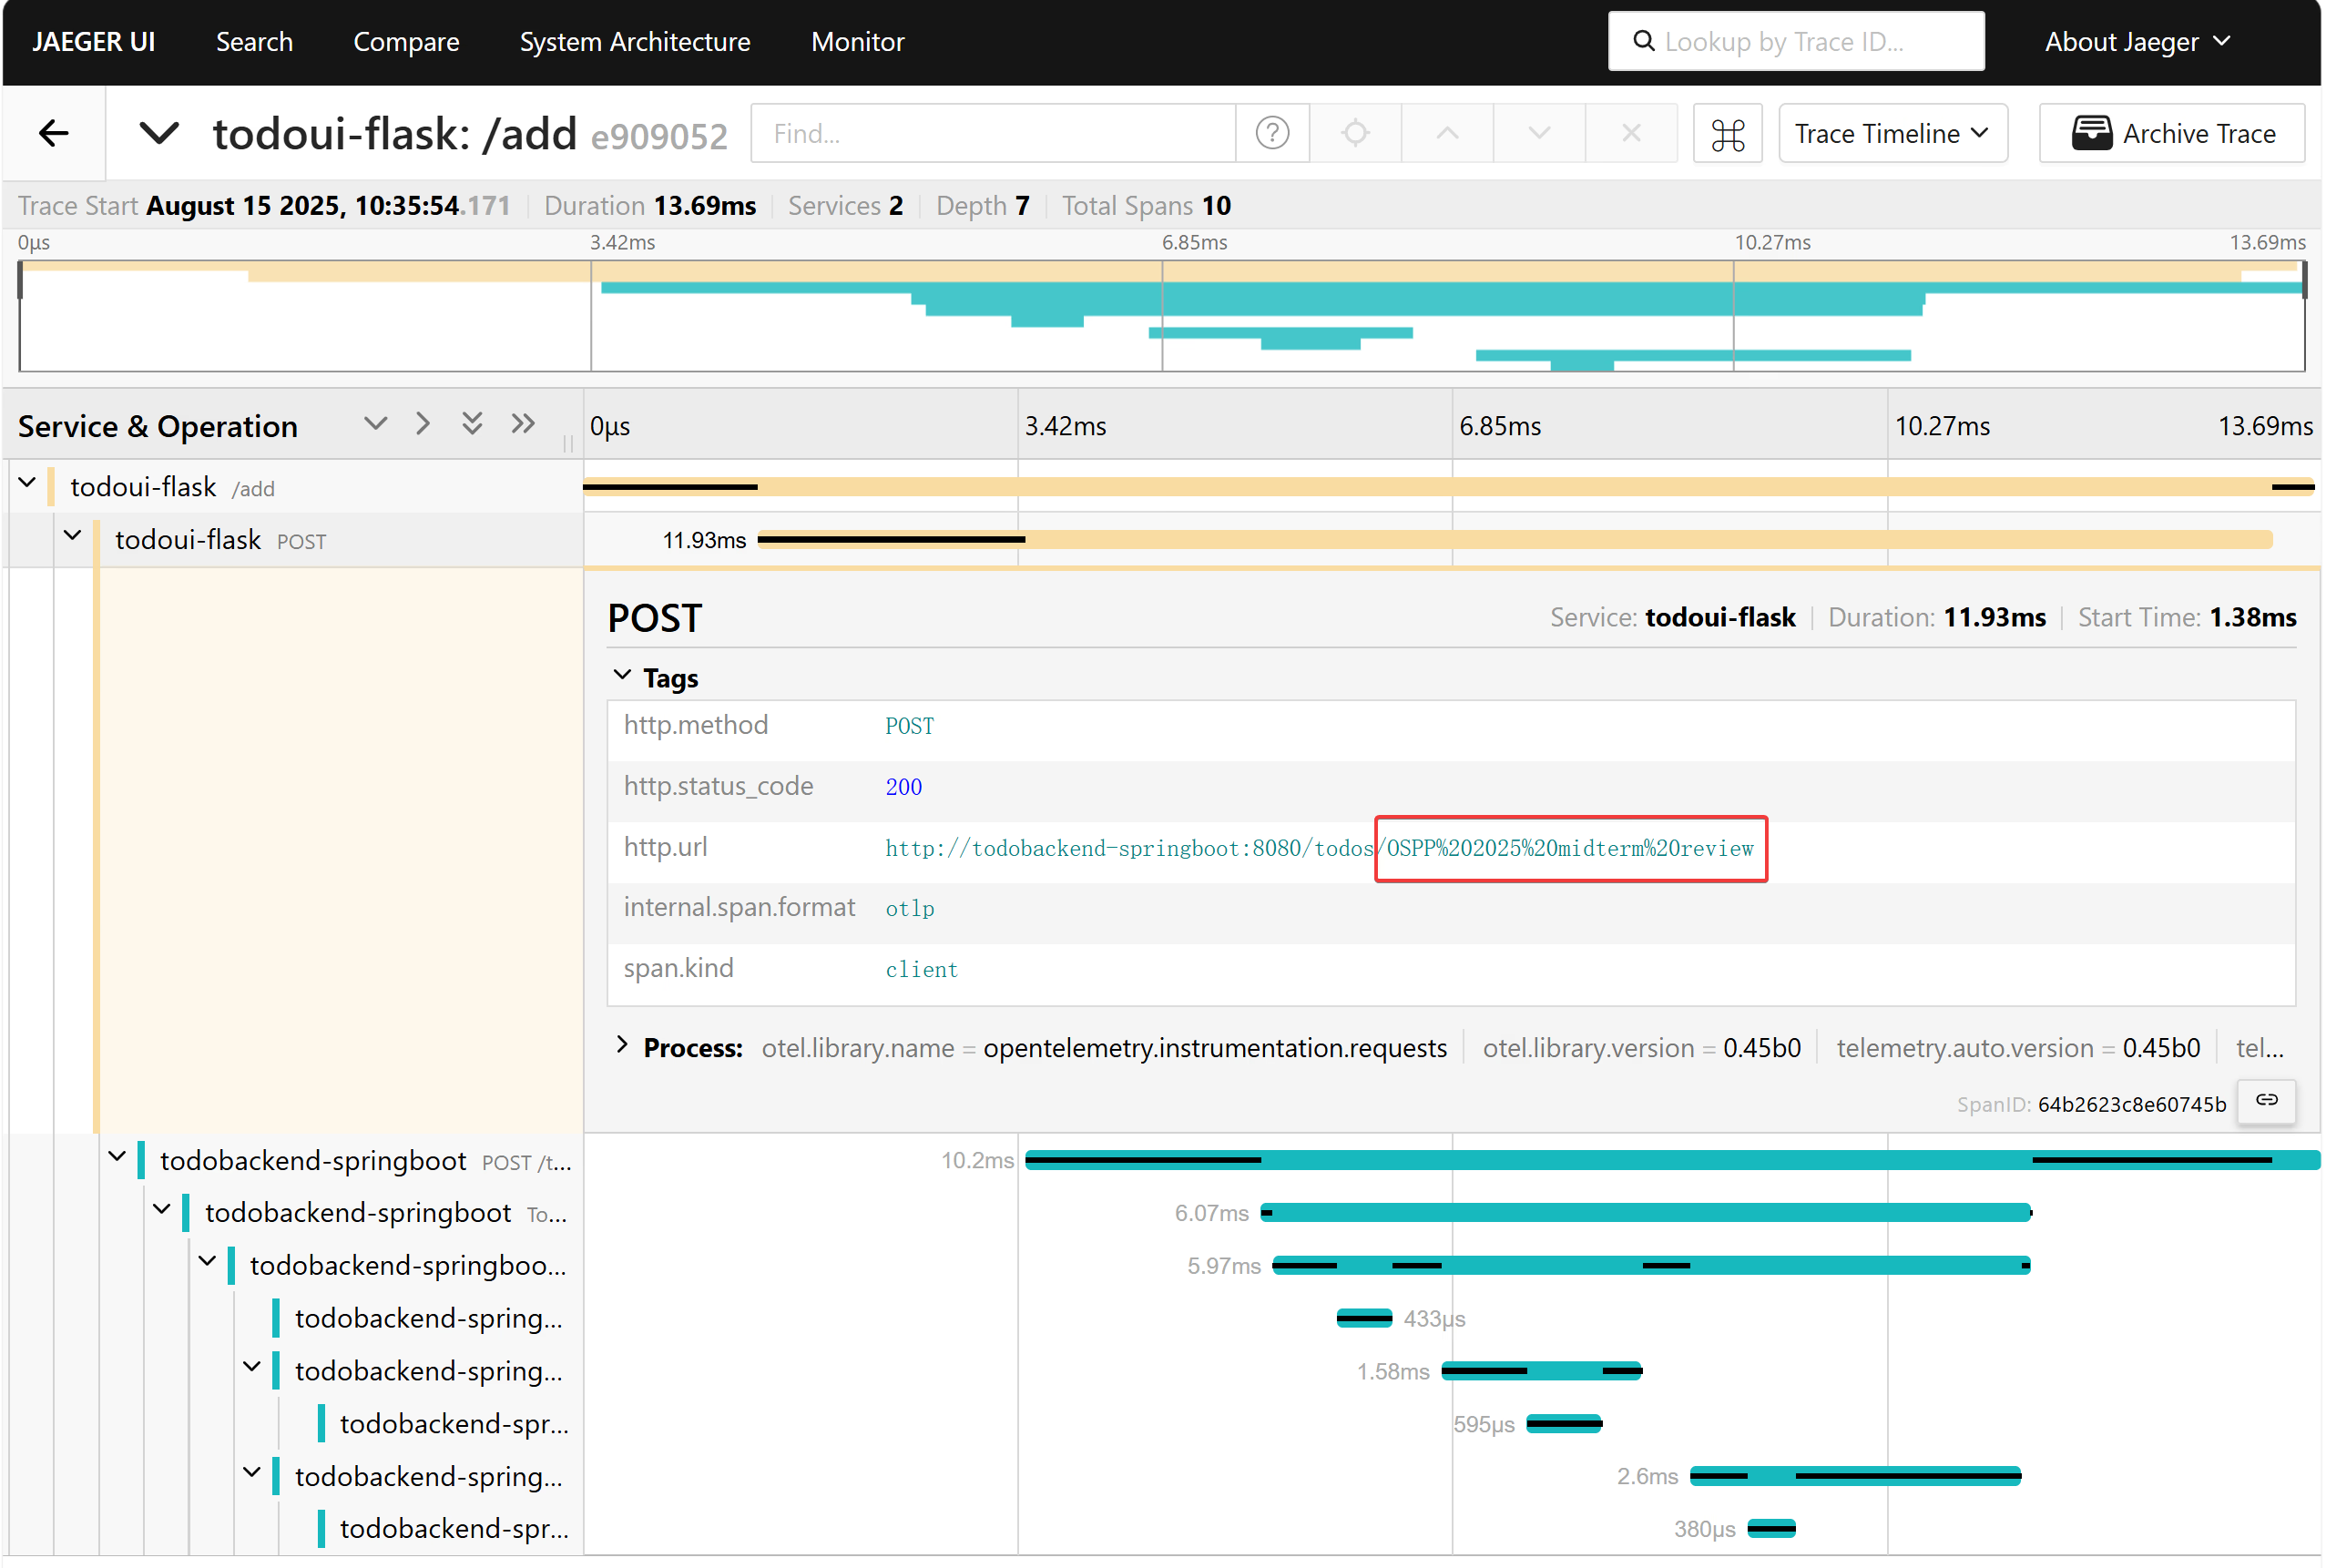
In Jaeger, you can see the complete process of a user request.
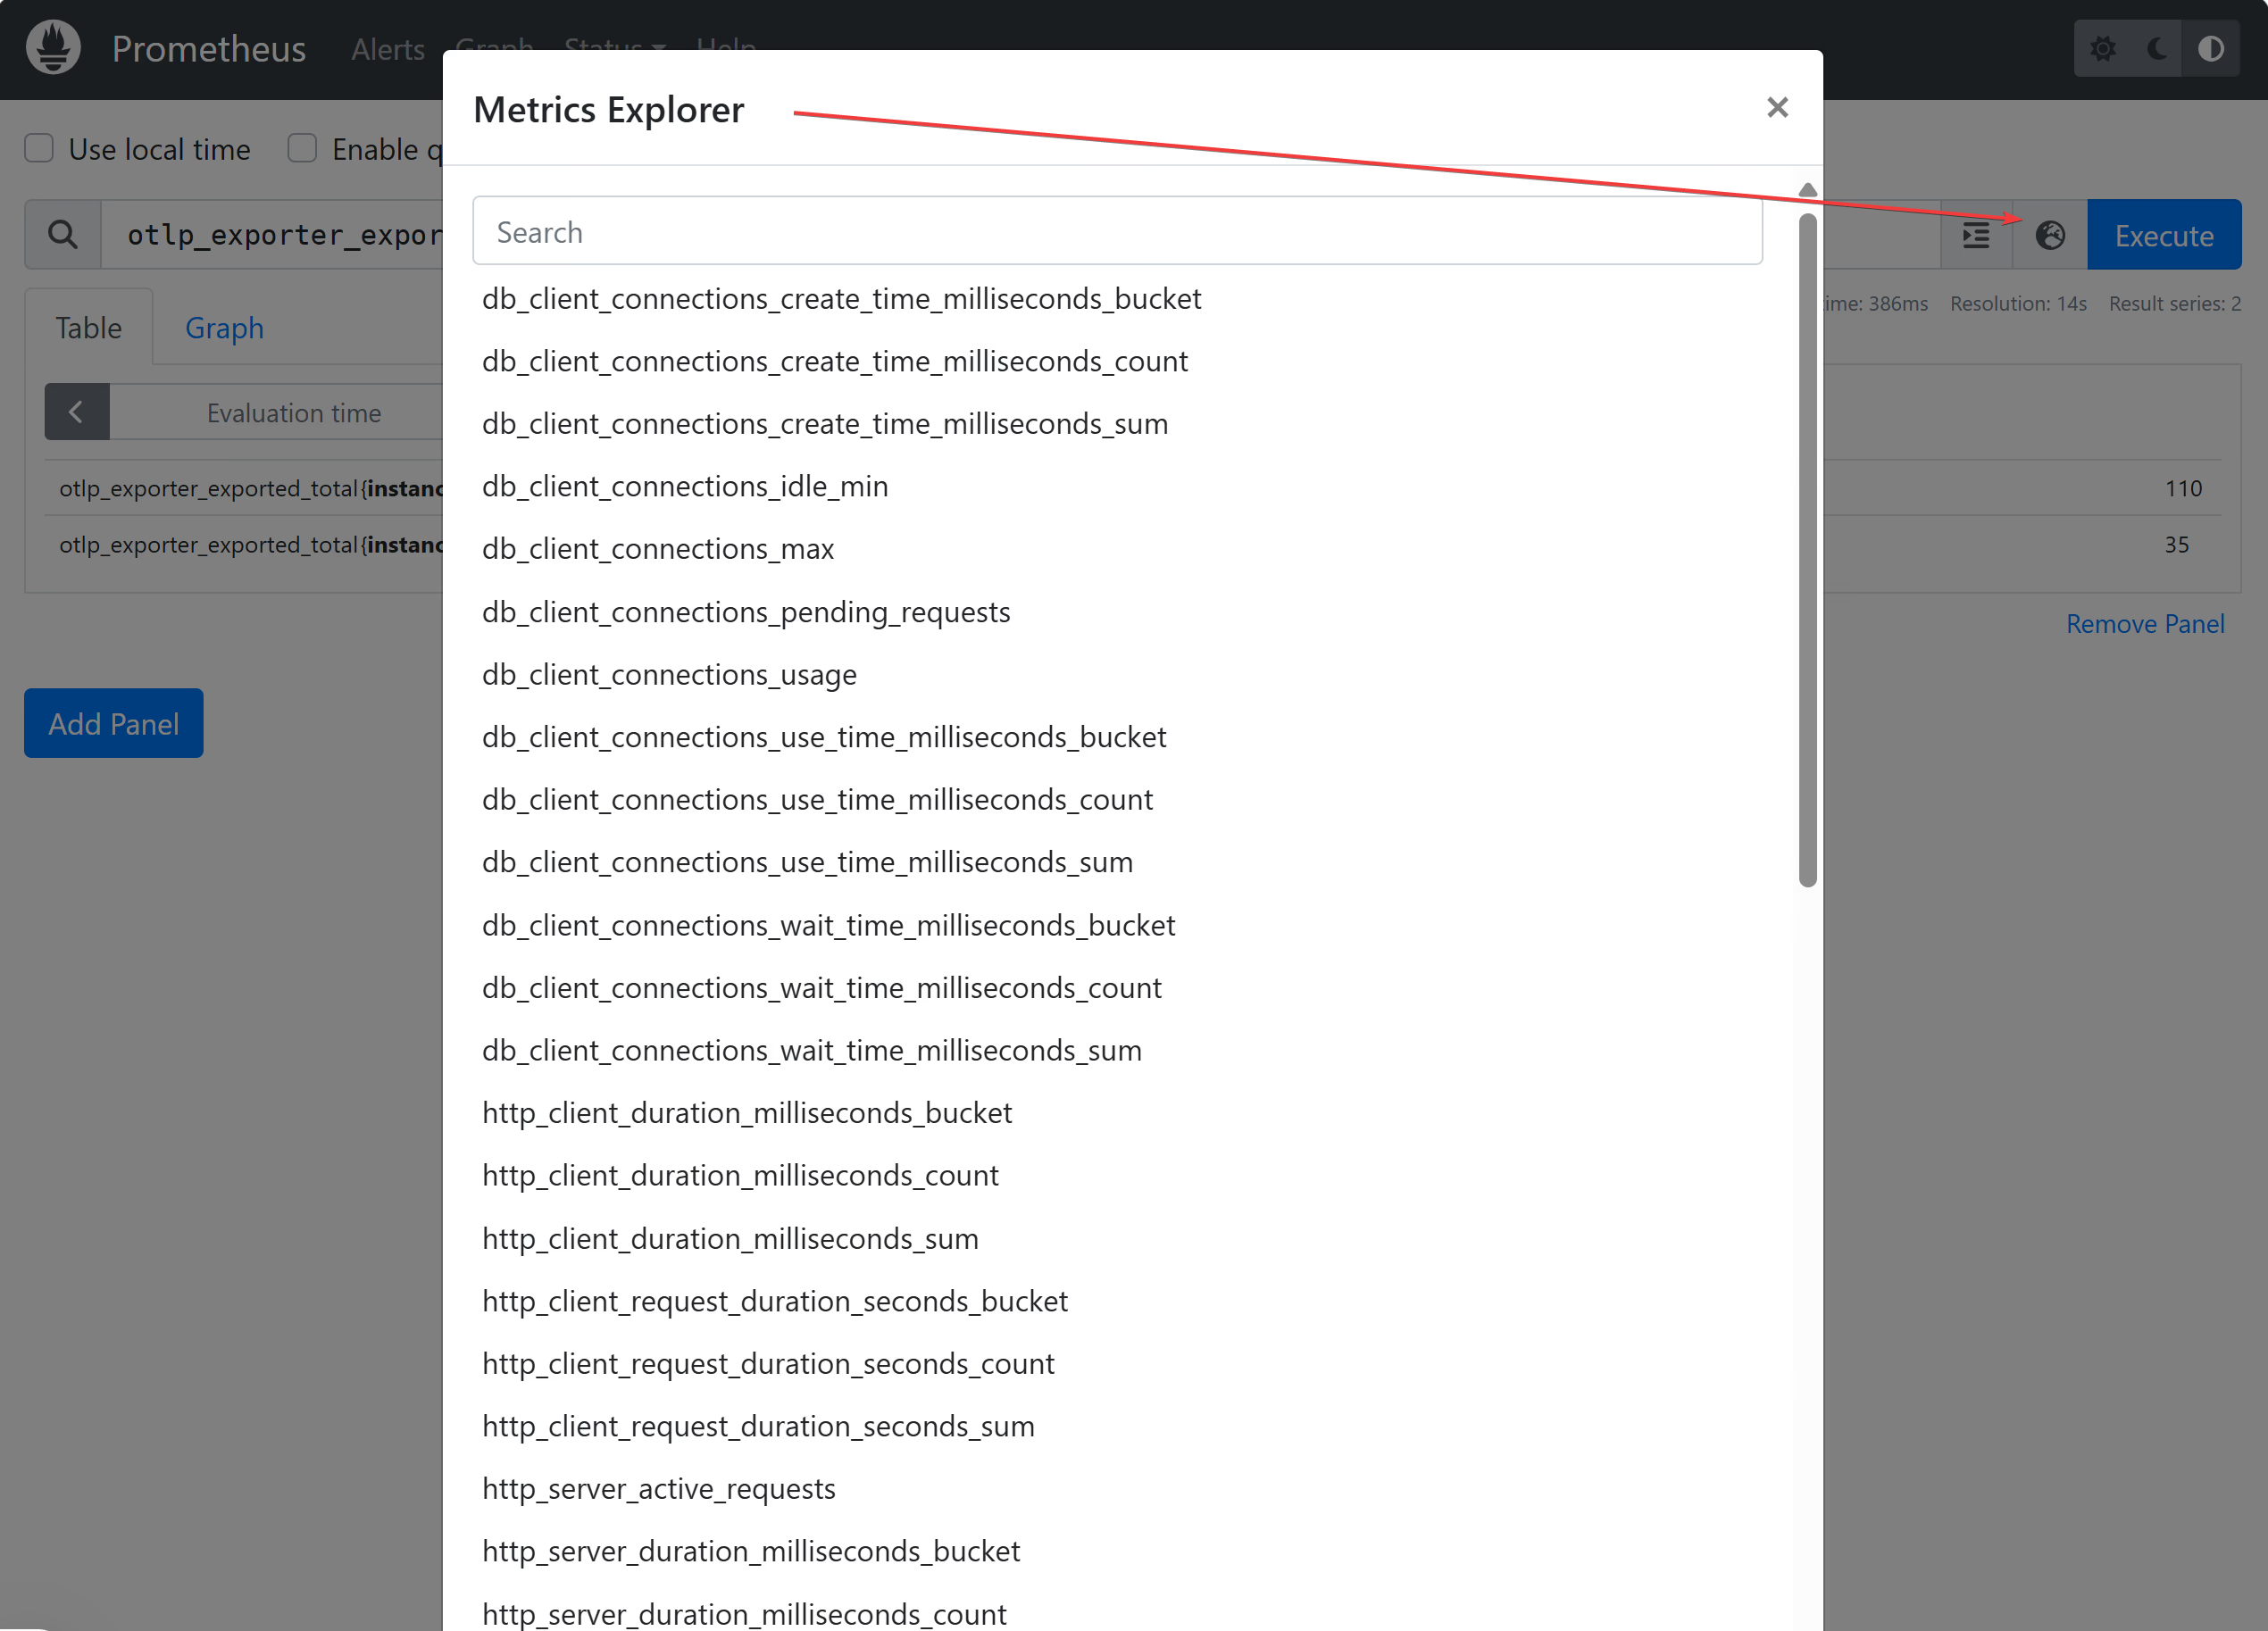
In Prometheus, you can see the collected metrics.
Later, Cursor and I created a new demo environment: 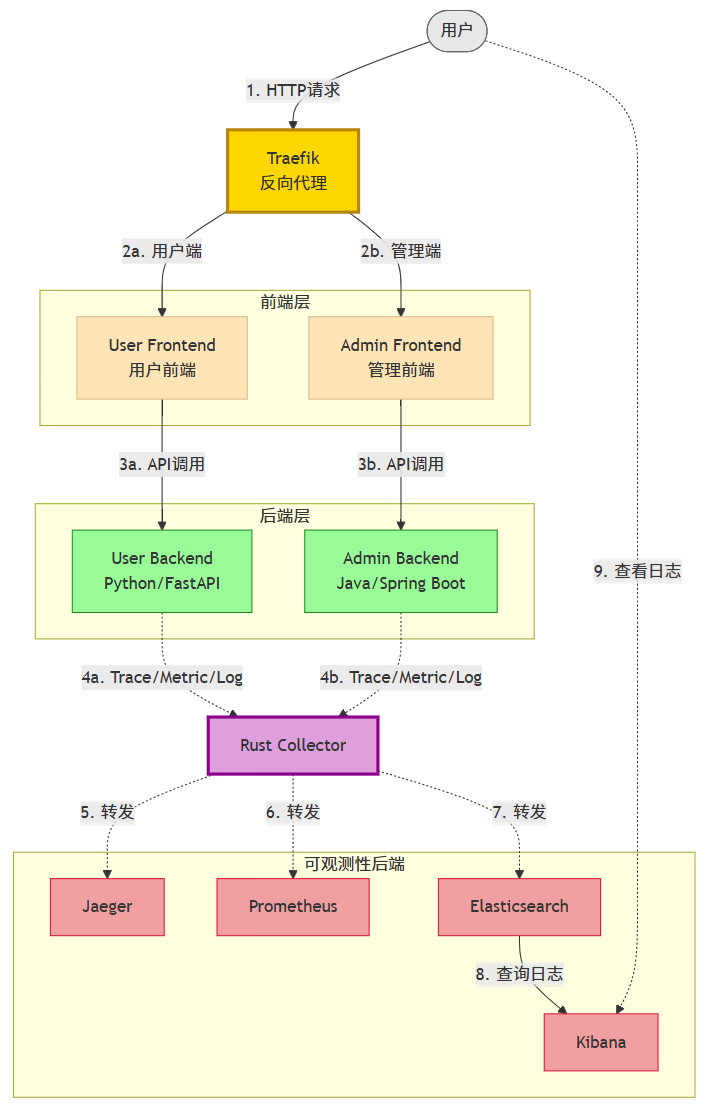
For this project’s scenario, the part above Rust Collector simulates deployment on a satellite, and the part below is ground-based. When the satellite cannot maintain 24-hour communication, a mechanism to quickly persist telemetry data to disk (WAL, described below) is needed, and then read and send when communication windows open.
WAL Persistent Storage
Inspired by database fast-write techniques, i.e., Write-Ahead Logging, data is appended sequentially to the end of a file, avoiding the need to load the entire file into memory for modification.
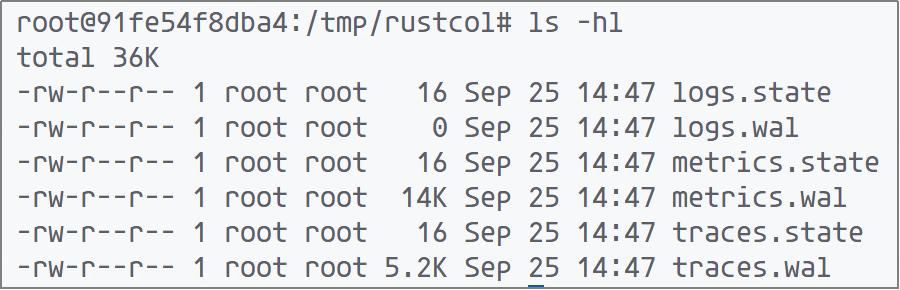
When OtlpHttpExporter receives a telemetry batch, it calls WalWriter to append the batch to the end of a persistent file. Inside the Rust Collector container, you can see persistent files for the three telemetry data types. 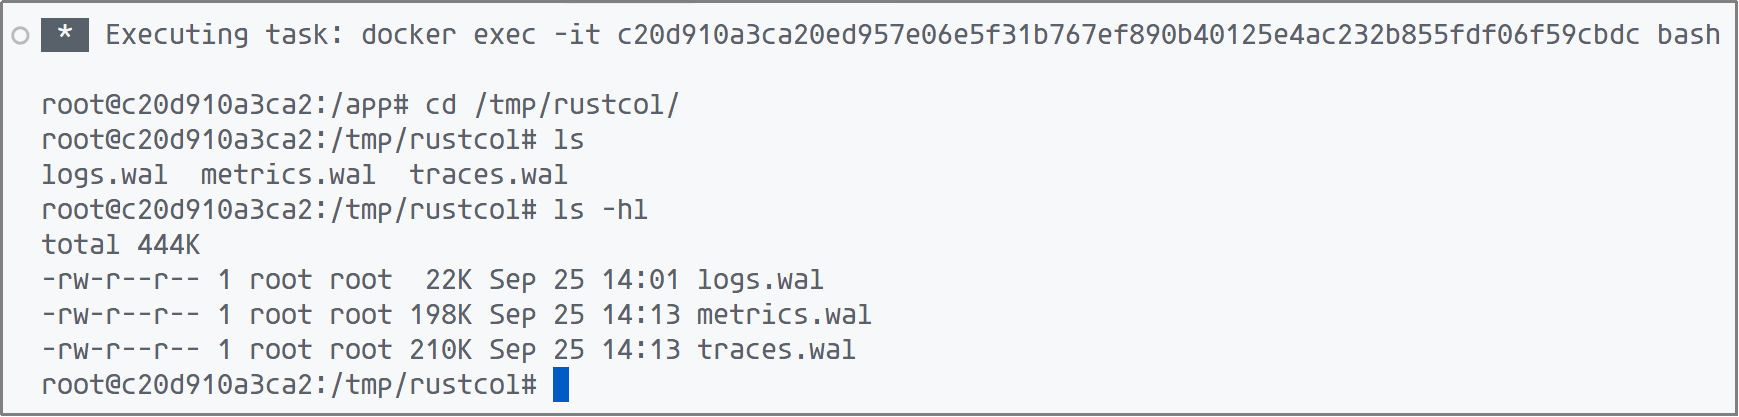
To support resumable transmission, a .state file records the current send progress. Based on this file, two important functions are implemented:
- File Compaction: When a communication window ends, already-sent content is deleted according to the progress in
.state, compressing the persistent storage. - Resumable Transmission: When the next window opens, sending can resume from where it stopped.
Exporter
For quick verification, the mid-term version didn’t include BatchProcessor or MemoryLimiter. Data from upstream was sent directly to the observability backend.
I implemented three Exporters:
- DebugExporter
- OtlpGrpcExporter
- OtlpHttpExporter
DebugExporter prints telemetry data to the terminal for debugging.
As described in the pdata section, since services are already defined, the gRPC-based OtlpExporter can be quickly implemented by directly calling the generated TraceServiceClient.
#[tonic::async_trait]
impl ConsumeTraces for OtlpGrpcExporter {
    /// Export traces to the gRPC endpoint
    async fn consume(&self, data: ExportTraceServiceRequest) {
        let mut client = TraceServiceClient::new(self.channel.clone());
        let _ = client.export(data).await;
    }
}
The HTTP-based OtlpHttpExporter uses tokio to launch two async tasks: sender and reader, while maintaining an in-memory queue. The reader task reads data from disk via WAL methods into the queue; the sender task reads from the queue and sends data via HTTP POST.
MemoryLimiter
Memory Limiter monitors and limits memory usage by periodically checking process memory usage and growth rate to prevent OOM. When the limit is exceeded, it refuses to place new data into the data pipeline, protecting system stability.
It uses a Tokio task to periodically monitor memory usage. Supports two check modes: memory usage limit and memory usage growth rate limit. Uses an atomic variable to record the over-limit status.
BatchProcessor
Batch Processor implements batch aggregation of telemetry data, combining small batches into larger ones via buffer and timer mechanisms to improve transmission efficiency. Separate BatchProcessors for traces, metrics, and logs, using TokioMutex to protect batch state. Supports two conditions for triggering the downstream consume method: telemetry count and timeout.
Conclusion
Where there’s a will, there’s a way.
Whether it was the pre-AI coding era — using old-school methods like reading and debugging to understand project structure and gradually achieve goals — or the Vibe Coding era — iterating with AI to refine implementations — it all points to one thing: keep moving towards the goal, adjust in time, and you will eventually arrive.
I think of a fate argument: some things just have to be done by someone. At this moment, you step up and do it. In the pre-AI era, code didn’t appear out of thin air — it took more effort. In the AI era, the certainty of completing a task seems higher. If it’s your task, as long as you work hard and use the right methods, AI will lend a hand.