2026-03-04 Instrumenting AI Applications Using OpenAI SDK for Large Model Requests
📆 Recorded on: 3/4/2026 Experimenting with two observable backend platforms: Langfuse (designed for large model applications) and Grafana.
Langfuse
Using Langfuse's native instrumentation library and OTel to instrument the application, observing the telemetry signals received on the Langfuse platform.
Langfuse Native Instrumentation
Without the observe decorator
Using Langfuse's own instrumentation library, the effect before using the @observer decorator is as follows.
PROJECT_NAME/observability/tracing:

Trace record 1: 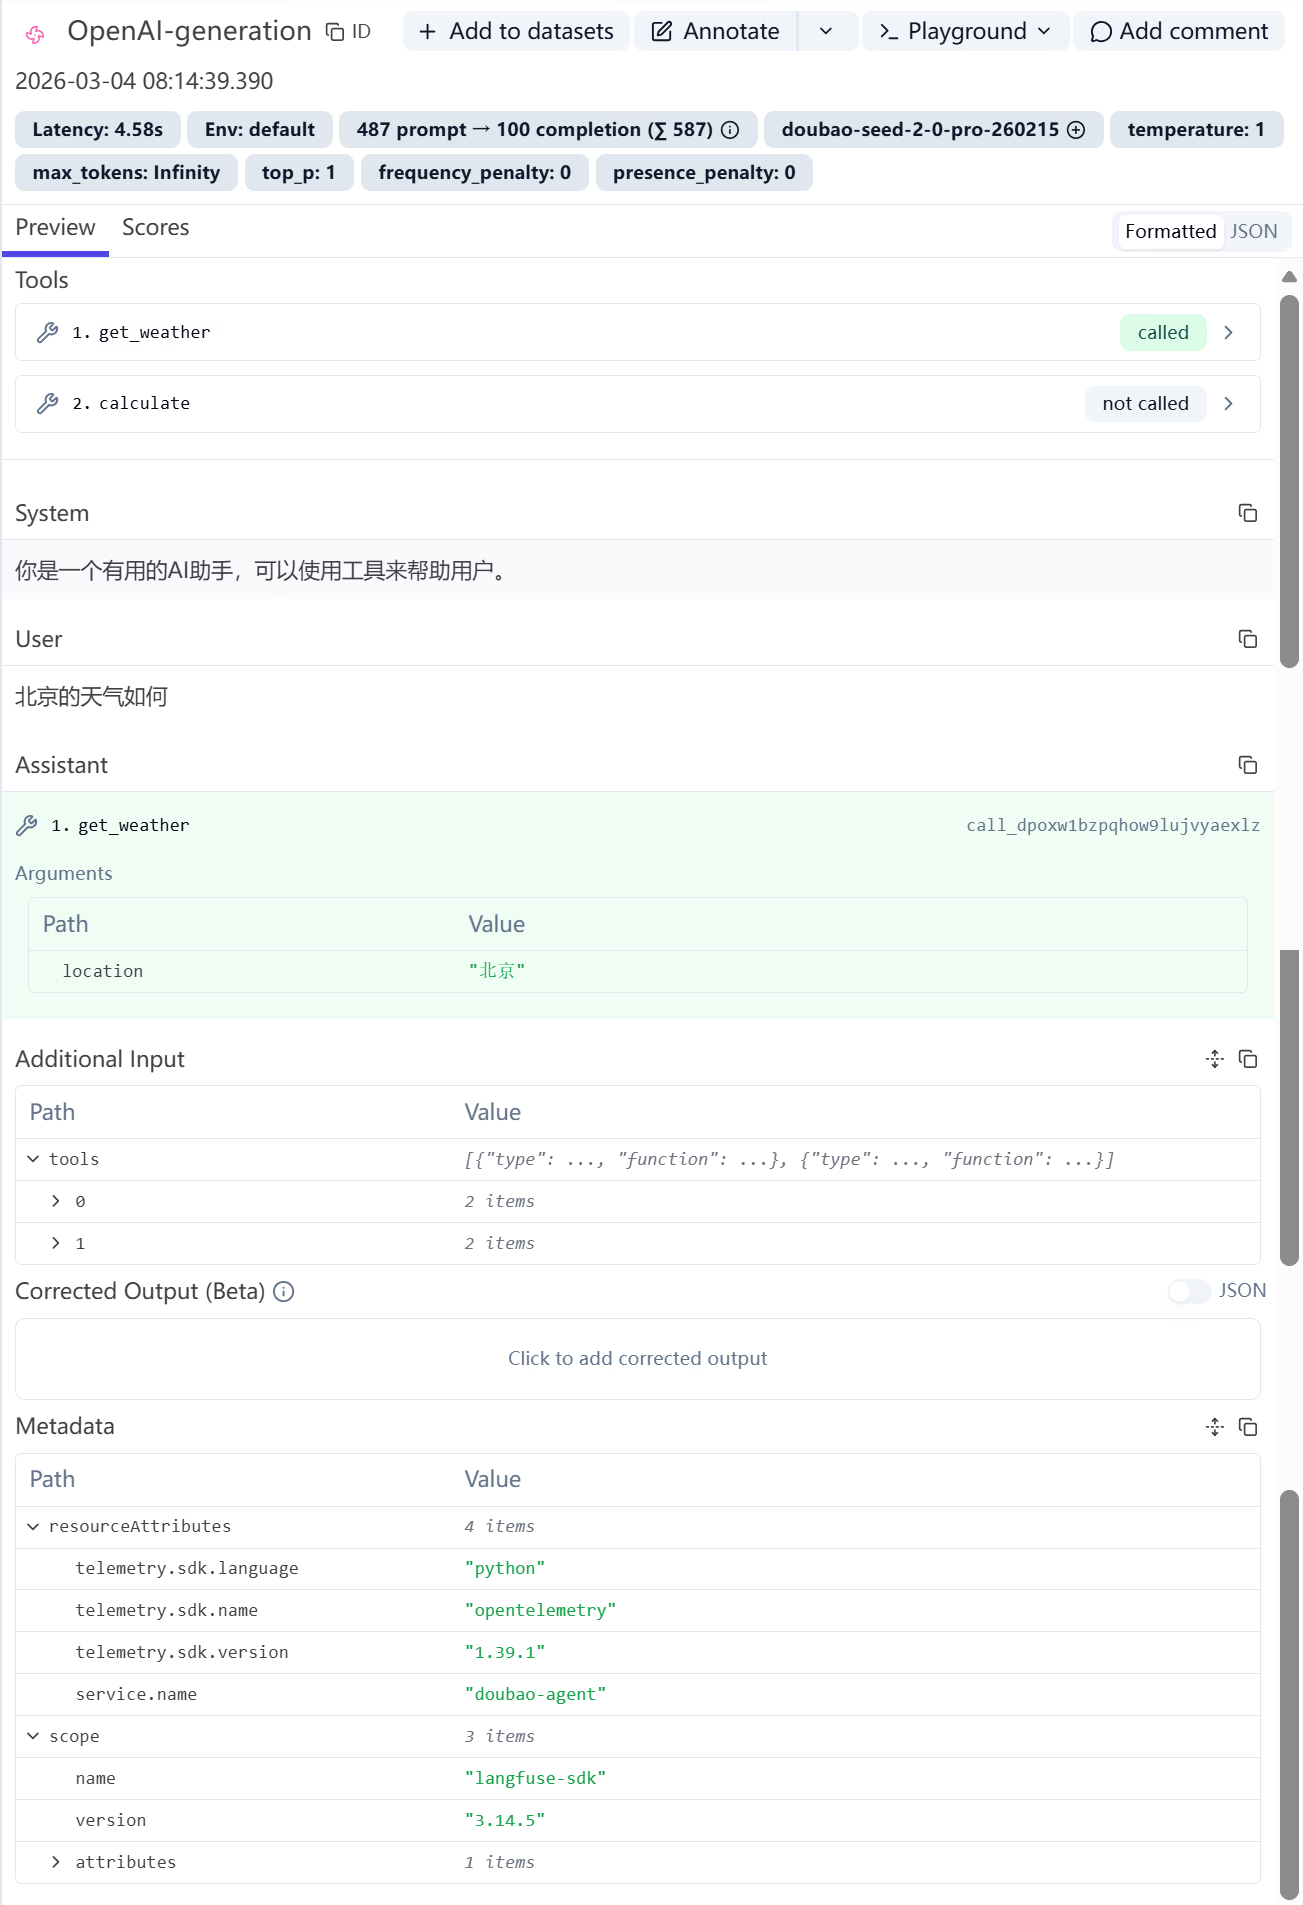
Trace record 2: 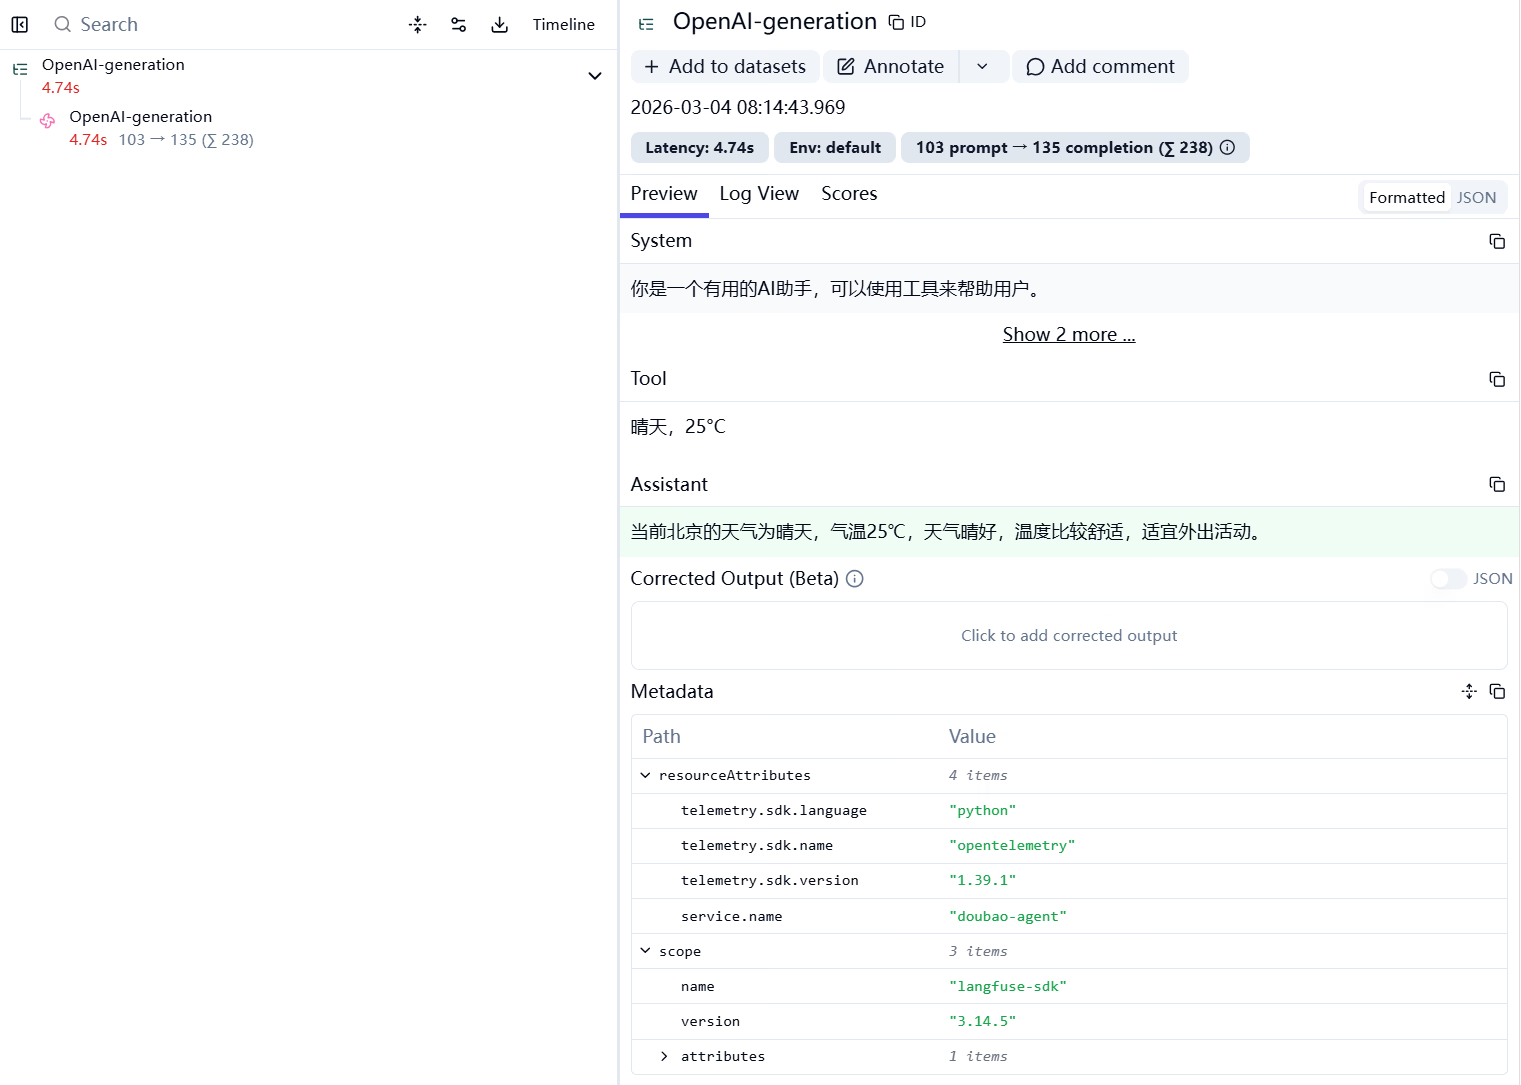
The strange thing is that the telemetry is not combined into a structured piece but is split into two records. The first record contains the user's input and the large model's tool call, and the second record contains the large model's response.
Using the observe decorator
After reading the Langfuse documentation carefully, I found that an observe decorator can be added to the function responsible for large model requests to introduce observability.
from langfuse.openai import OpenAI
from langfuse import observe

client = OpenAI(
    base_url=os.environ.get("LLM_URL"),
    api_key=os.environ.get("OPENAI_API_KEY"),
)

@observe
def chat_with_agent(user_message: str) -> str:
    response = client.chat.completions.create(
        model=MODEL,
        messages=messages,
        tools=tools,
        tool_choice="auto",
    )
After using the observe decorator, the two original records seem to be combined into one. 
Trace record "How's the weather in Beijing?" first sub-record: 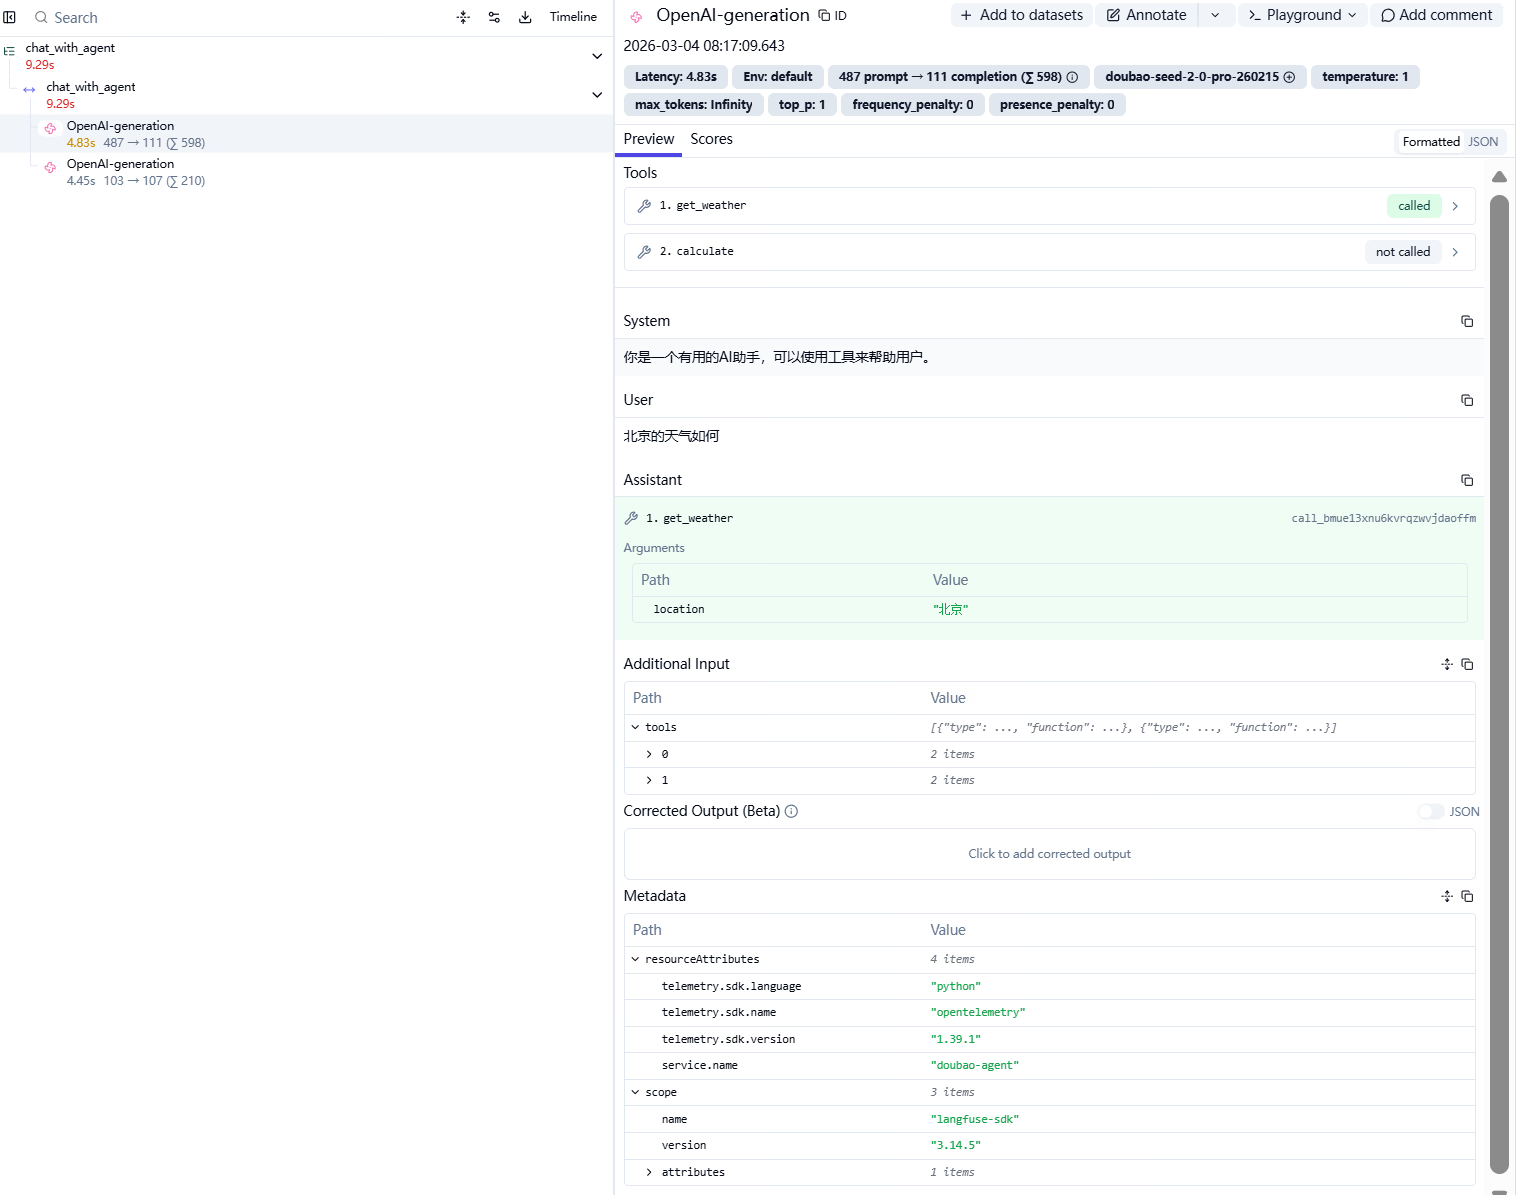 Second sub-record: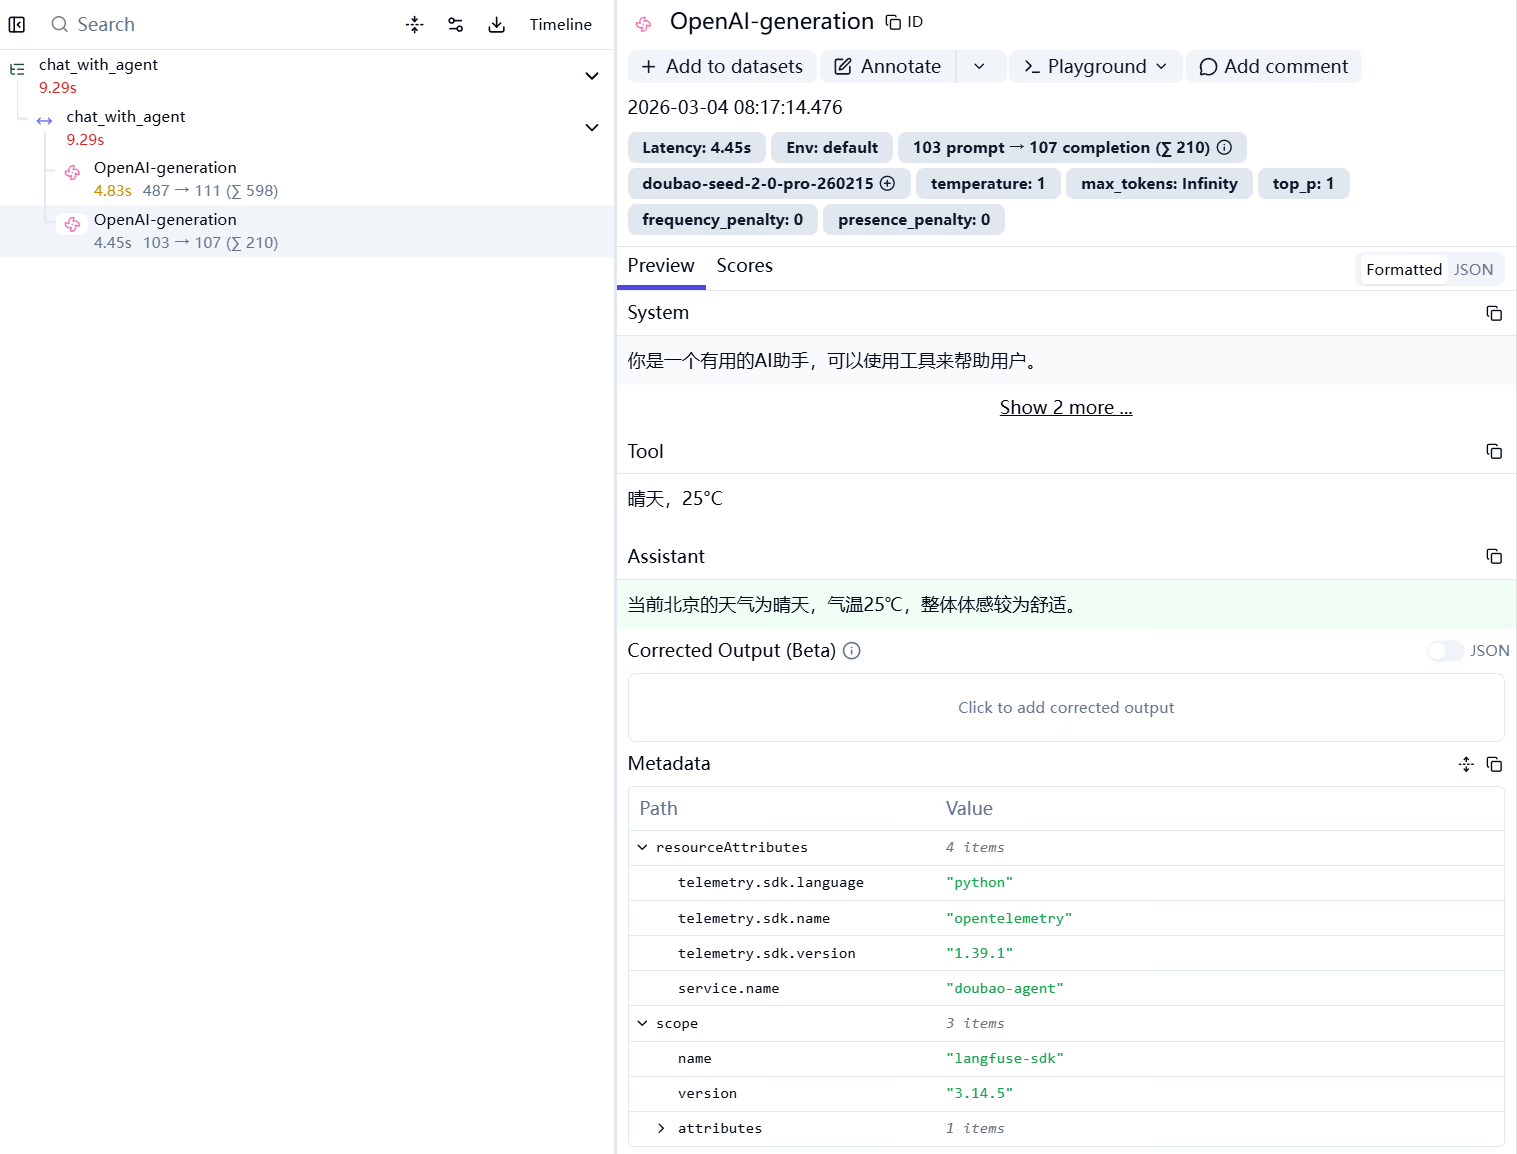
OpenTelemetry
Using opentelemetry-instrumentation-openai-v2
Capturing message content
This library can configure whether to capture interaction content via environment variables:
span_only- Used to enable content capturing on span attributes when latest experimental features are enabled.
Ensure OTEL_SEMCONV_STABILITY_OPT_IN is set to gen_ai_latest_experimental, then set the appropriate value for OTEL_INSTRUMENTATION_GENAI_CAPTURE_MESSAGE_CONTENT to enable message content capture.
- OTEL_INSTRUMENTATION_GENAI_CAPTURE_MESSAGE_CONTENT=span_only
- OTEL_SEMCONV_STABILITY_OPT_IN=gen_ai_latest_experimentalopentelemetry-instrument python main.pyFor some reason, under "manual instrumentation" mode, message content was not captured.
Manual instrumentation
opentelemetry-instrumentation-openai-v2 uses Monkey Patching to instrument the OpenAI SDK. Simply put, it replaces the original functions in the OpenAI SDK used for large model requests at runtime with new functions wrapped in observability logic, thereby generating telemetry signals.
from opentelemetry import trace

from opentelemetry.exporter.otlp.proto.grpc.trace_exporter import (
    OTLPSpanExporter,
)
from opentelemetry.instrumentation.openai_v2 import OpenAIInstrumentor
from opentelemetry.sdk.trace import TracerProvider
from opentelemetry.sdk.trace.export import BatchSpanProcessor

# configure tracing
trace.set_tracer_provider(TracerProvider())
trace.get_tracer_provider().add_span_processor(BatchSpanProcessor(OTLPSpanExporter()))

OpenAIInstrumentor().instrument()

client = OpenAI(
    base_url=os.environ.get("LLM_URL"),
    api_key=os.environ.get("OPENAI_API_KEY"),
)
record 1 sub-tab 1: 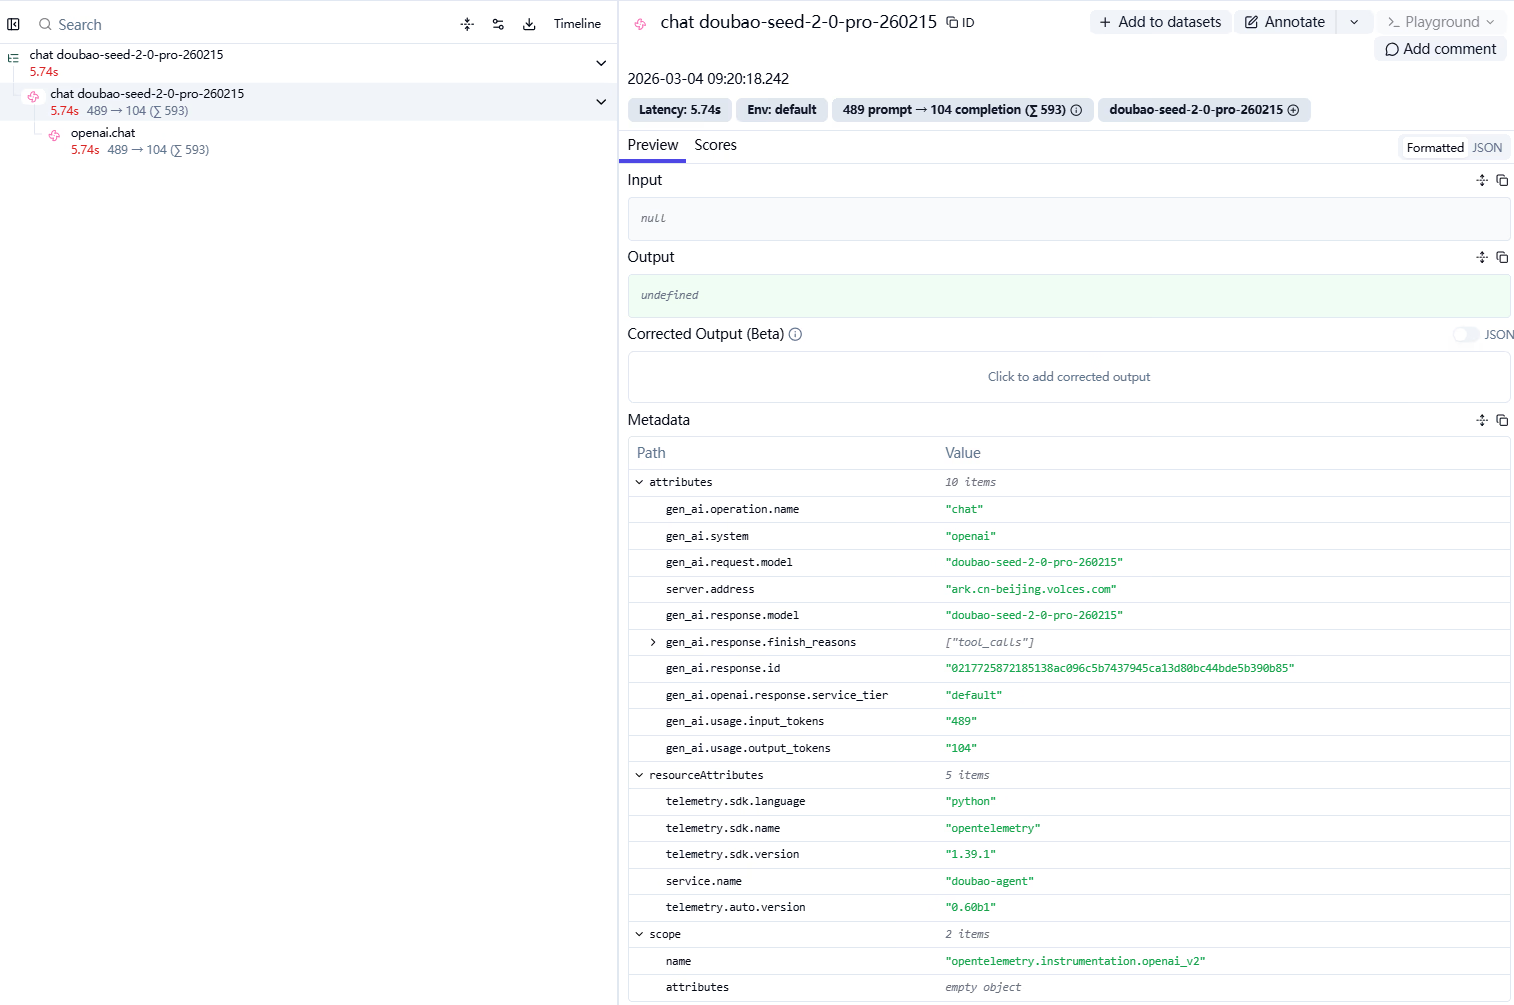
record 1 sub-tab 2:
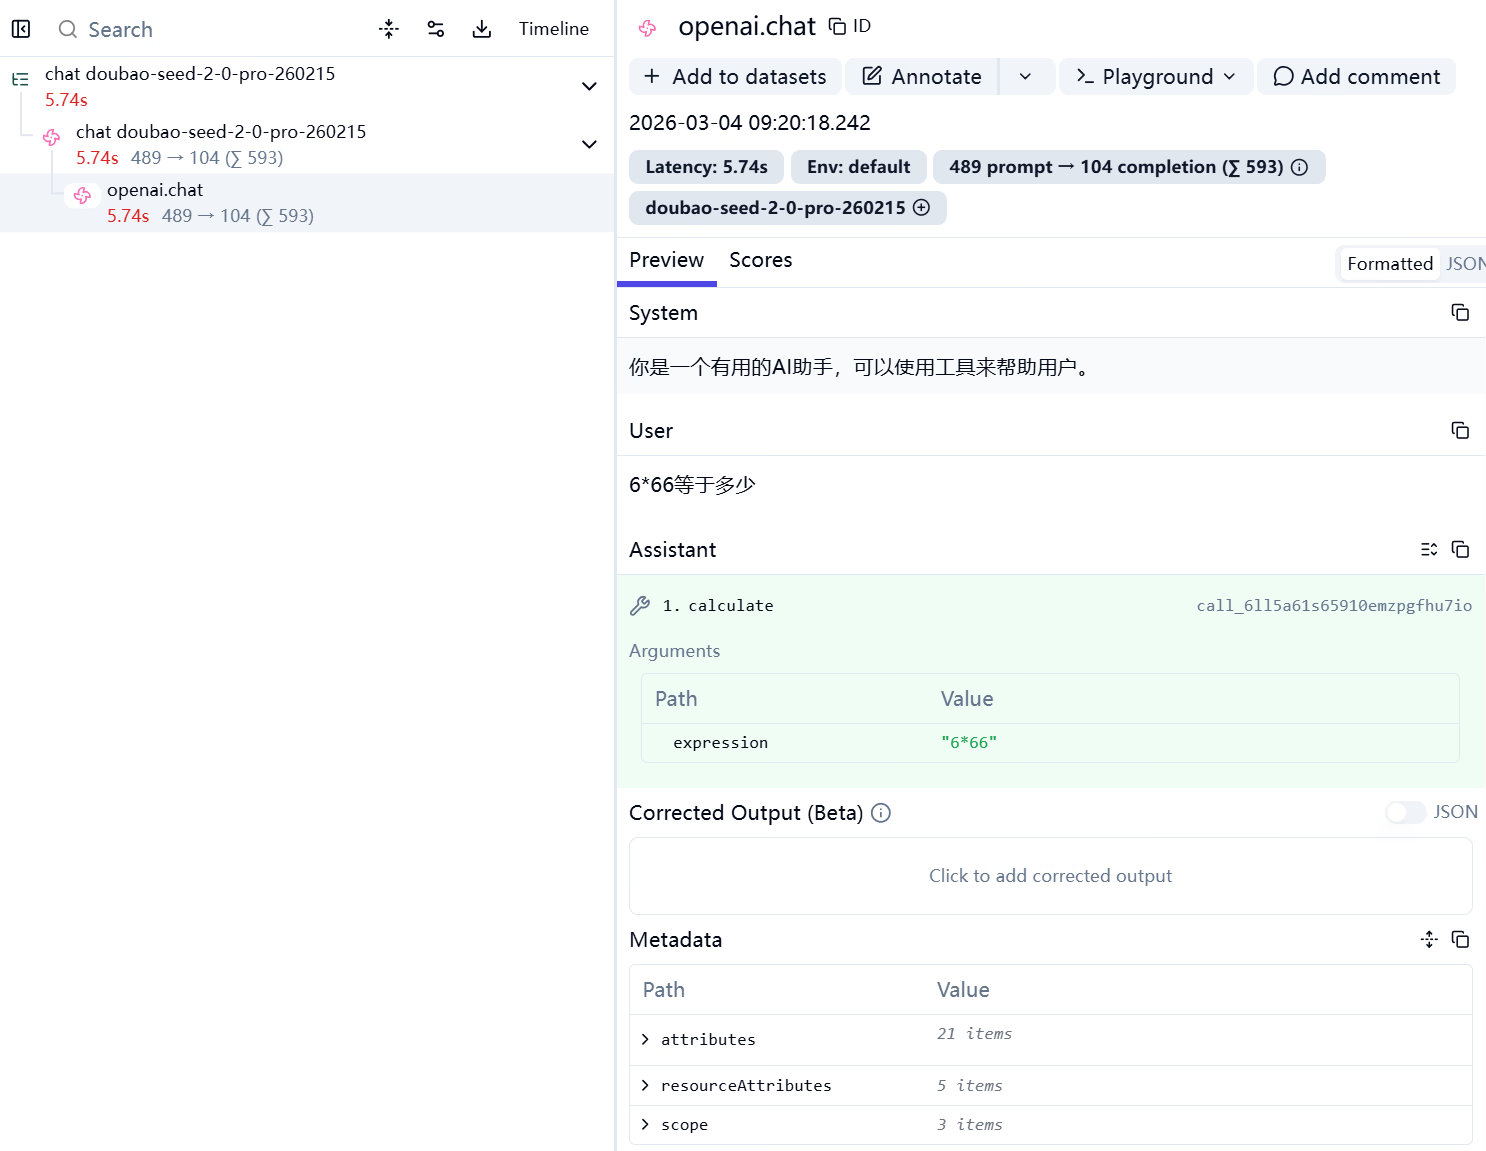
Automatic instrumentation
After using automatic instrumentation, more content was obtained, and user input and large model output content could be captured.
record 1: 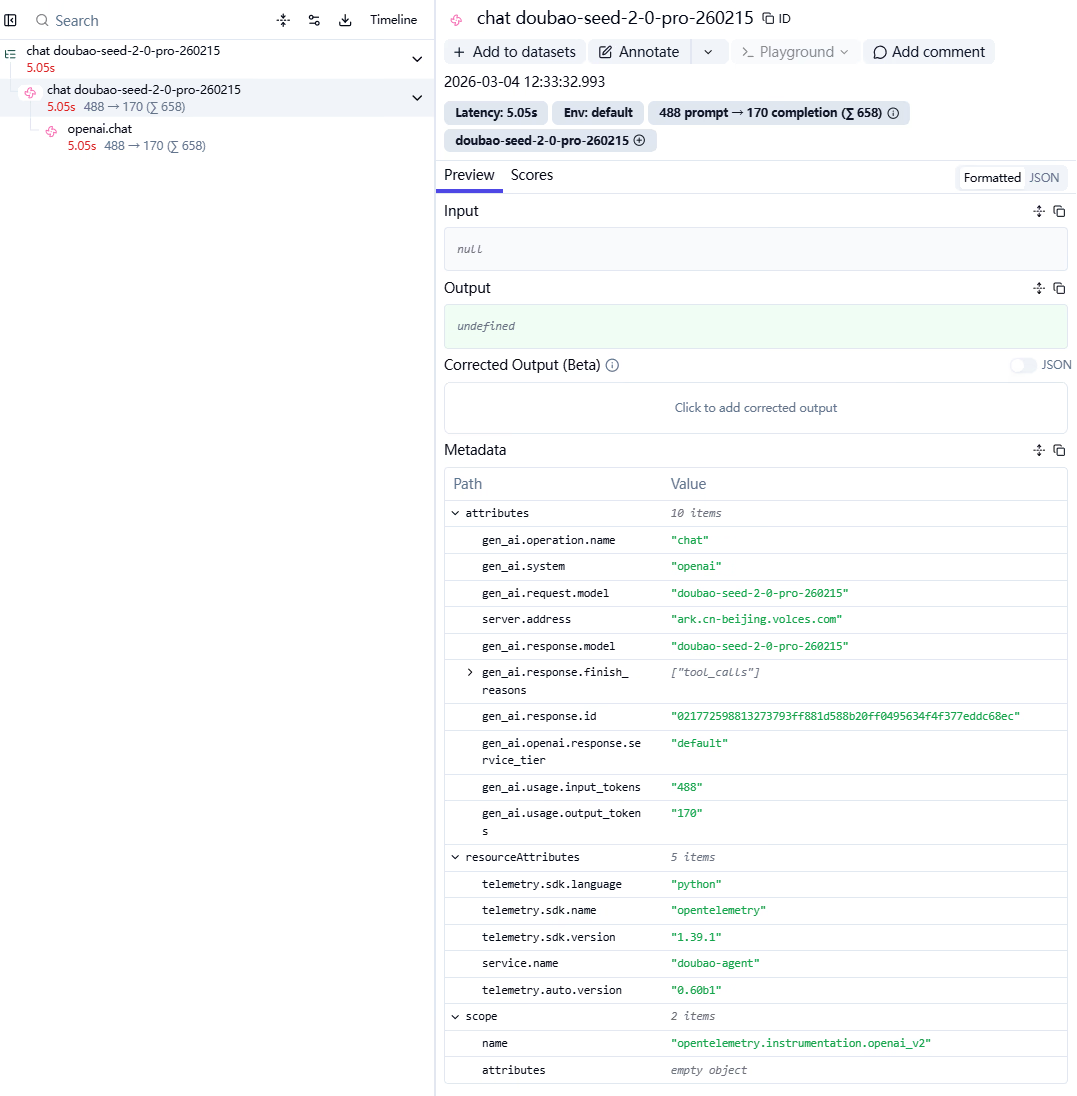 record 2: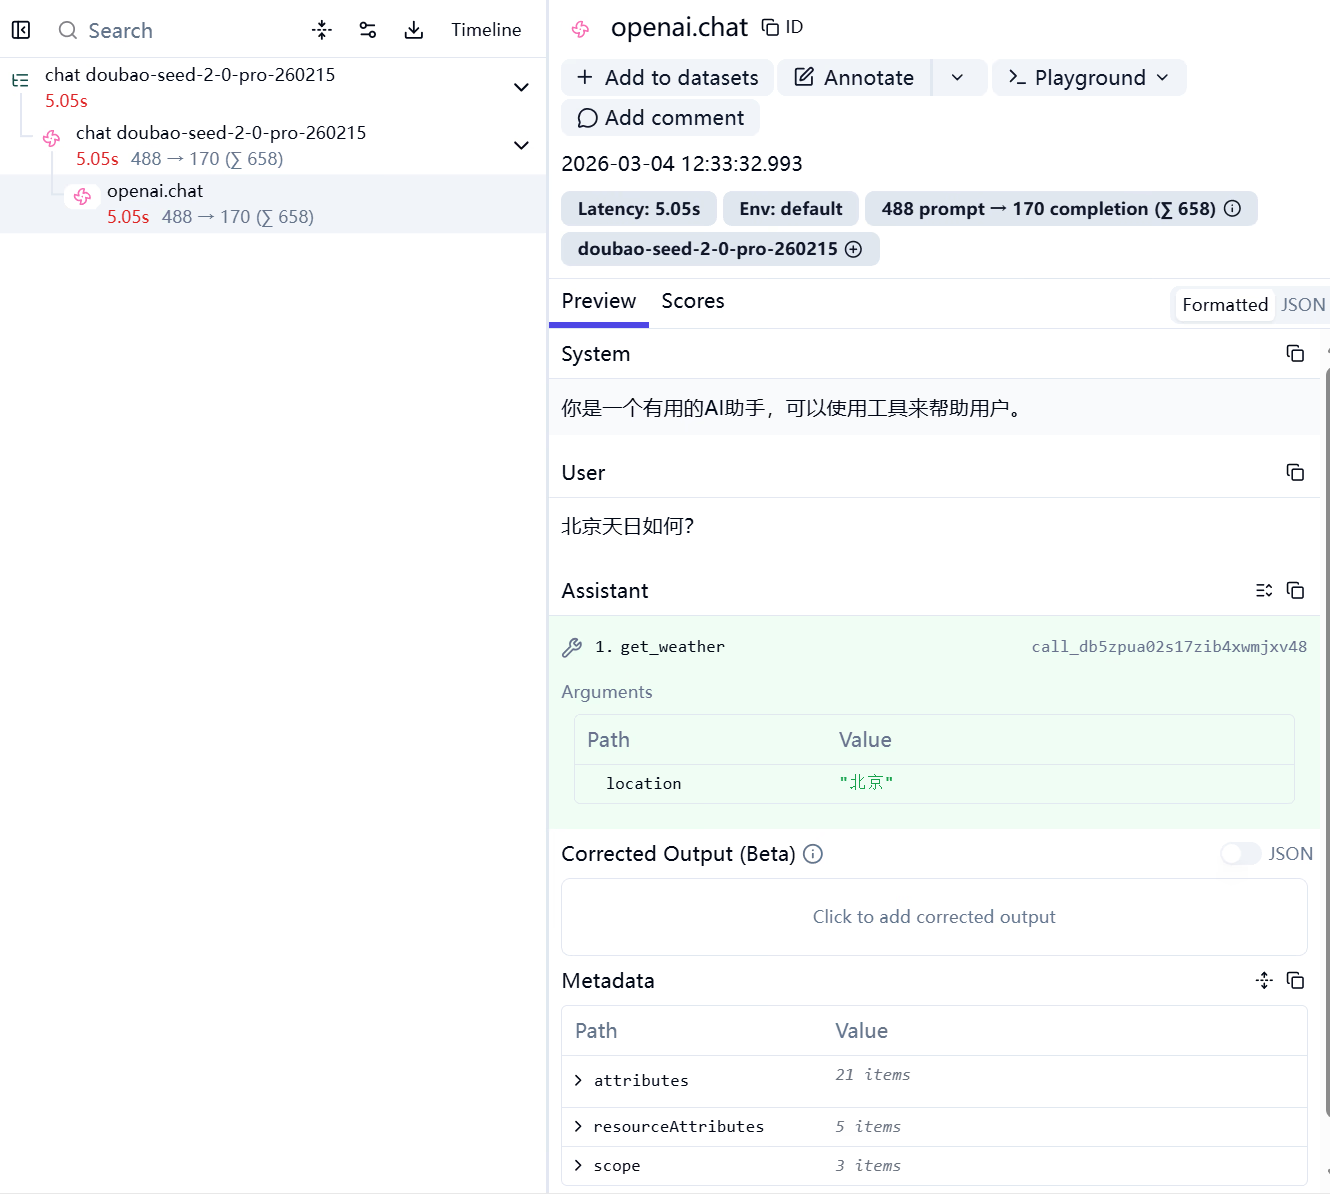
Analyzing Telemetry Signals
Comparing Langfuse native instrumentation and OTel instrumentation, the former displays richer information on the Langfuse platform, but this alone cannot determine whether the issue is due to Langfuse's compatibility with OTel or inadequate OTel instrumentation.
Next, we will identify this issue by viewing the OTel telemetry received by the OTel Collector. In otel-collector-config.yaml, configure to store telemetry to a file:
exporters:
  debug:
    verbosity: detailed
  file:
    path: /otel-logs/telemetry.json
    rotation:
      max_megabytes: 100
      max_backups: 10
    format: json
    create_directory: true
Taking one request as an example:
sequenceDiagram
	actor User
	participant doubao-agent
	participant Model as doubao-seed-2-0-pro-260215

	User->>doubao-agent: Ask: How's the weather in Beijing?
	note over doubao-agent: Generate parent Span (be924a34e4eaa643)<br/>Record: overall call info
	note over doubao-agent: Generate child Span (be2fc86423365f08)<br/>Record: detailed interaction info
	doubao-agent->>Model: Initiate chat request (includes system prompt + user question + tool definitions)
	Model->>Model: Analyze request, decide to call get_weather tool
	Model-->>doubao-agent: Return response (tool call instruction: {"location": "Beijing"})
	note over doubao-agent: End both Spans (duration ~3.84 seconds)
	doubao-agent-->>User: Call weather tool and return Beijing weather result
What puzzled me was that two Spans with overlapping information appeared. After careful observation, I found that the span carrying message content (prompts, model responses) was generated by opentelemetry.instrumentation.openai.v1, and the other span was generated by opentelemetry.instrumentation.openai_v2. Moreover, the span generated by v2 precedes the one from v1, and v2 produces the parent span.
{
    "resourceSpans": [
        {
            "resource": {
                "attributes": [...]
            },

            "scopeSpans": [
                {
                    "scope": {
                        "name": "opentelemetry.instrumentation.openai.v1",
                        "version": "0.52.5"
                    },
                    "spans": [
                        {
                            "traceId": "7d234113586922e7048973b1055ea751",
                            "spanId": "be2fc86423365f08",
                            "parentSpanId": "be924a34e4eaa643",...
                        }
                    ]
                },
                {
                    "scope": {
                        "name": "opentelemetry.instrumentation.openai_v2"
                    },
                    "spans": [
                        {
                            "traceId": "7d234113586922e7048973b1055ea751",
                            "spanId": "be924a34e4eaa643",...
                        },
                    ...
                }
             ]
        }
For this phenomenon, Doubao summarized:
- Parent Span focuses on "overall": records macro metrics of the AI call (duration, total tokens, core result), serving as the top-level identifier of the call;
- Child Span focuses on "details": records the full business parameters of the AI call (prompt, tool definitions, call parameters), serving as the detailed log of the call;
Parent span (v2) corresponds to: 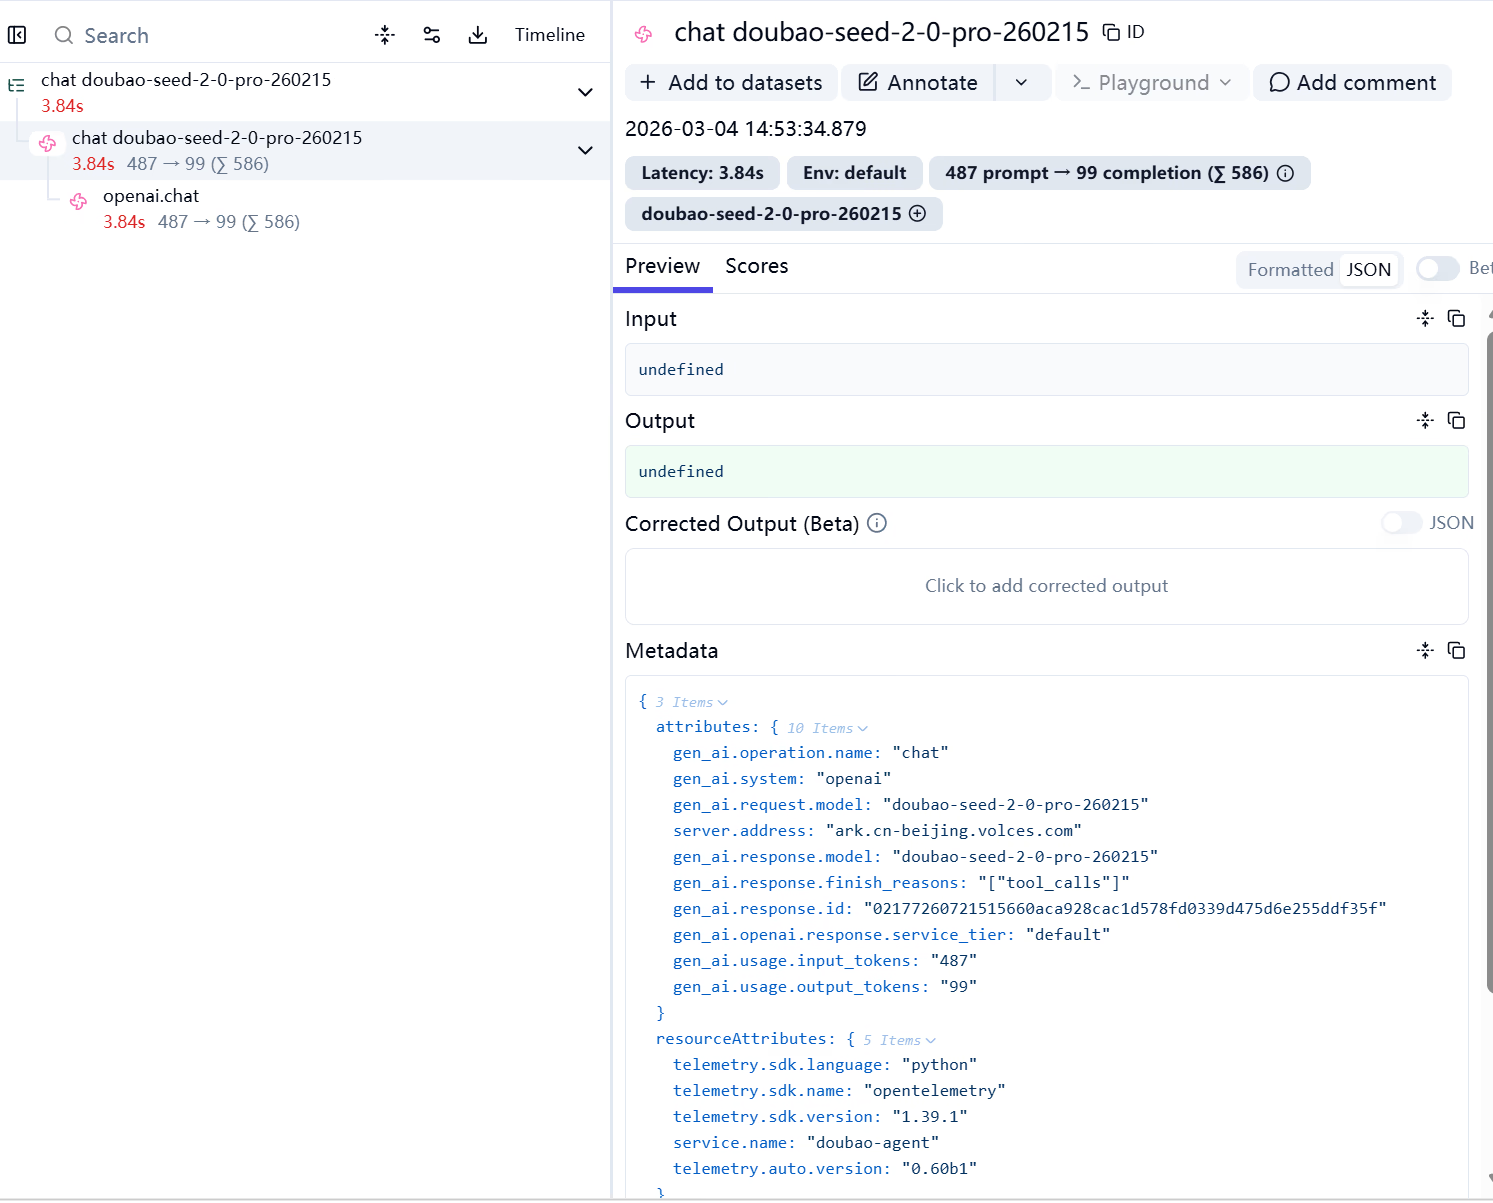
Child span (v1) corresponds to: 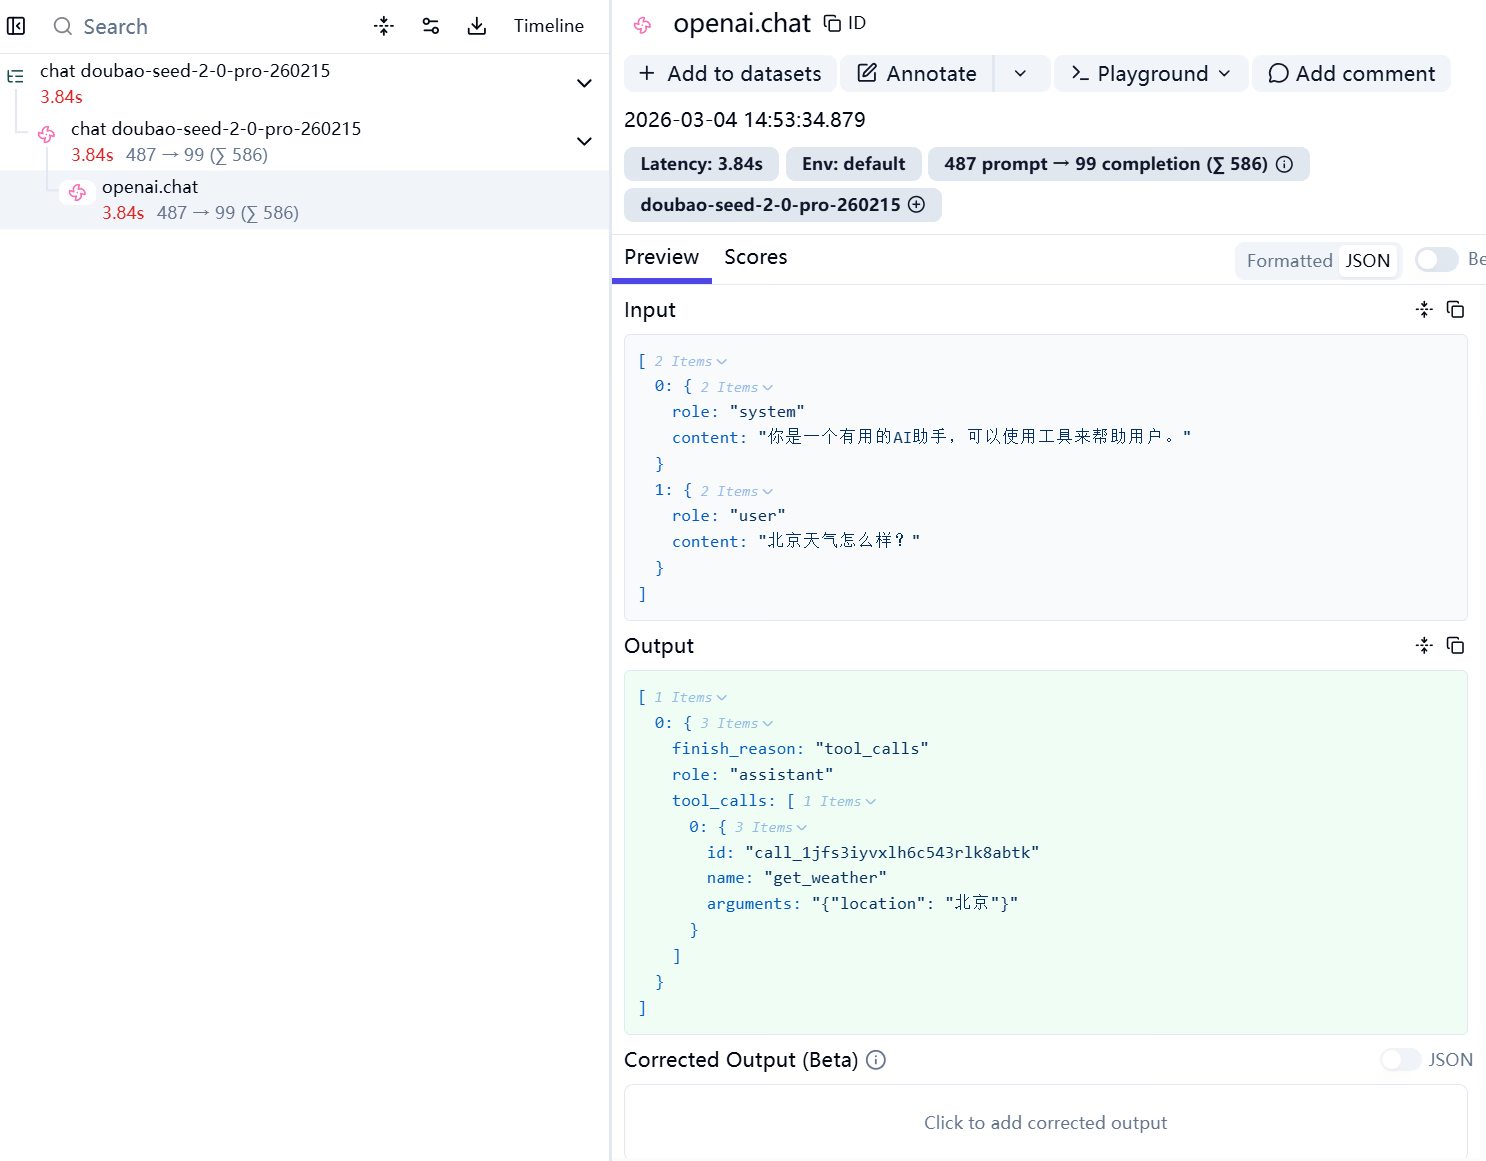
Big Facepalm Moment: Poor Dependency Management
How could two versions of the instrumentation library run simultaneously?
I checked the dependencies and found that both v1 and v2 versions of the instrumentation library were indeed present. I had probably been following the documentation while typing commands without thinking about potential issues.
Official Instrumentation Library Documentation Not Updated
After removing the v1 dependency, only one span remained. Why couldn't I see captured message content in the v2 span?
I opened the repository for the v2 instrumentation library and asked Kimi Code. 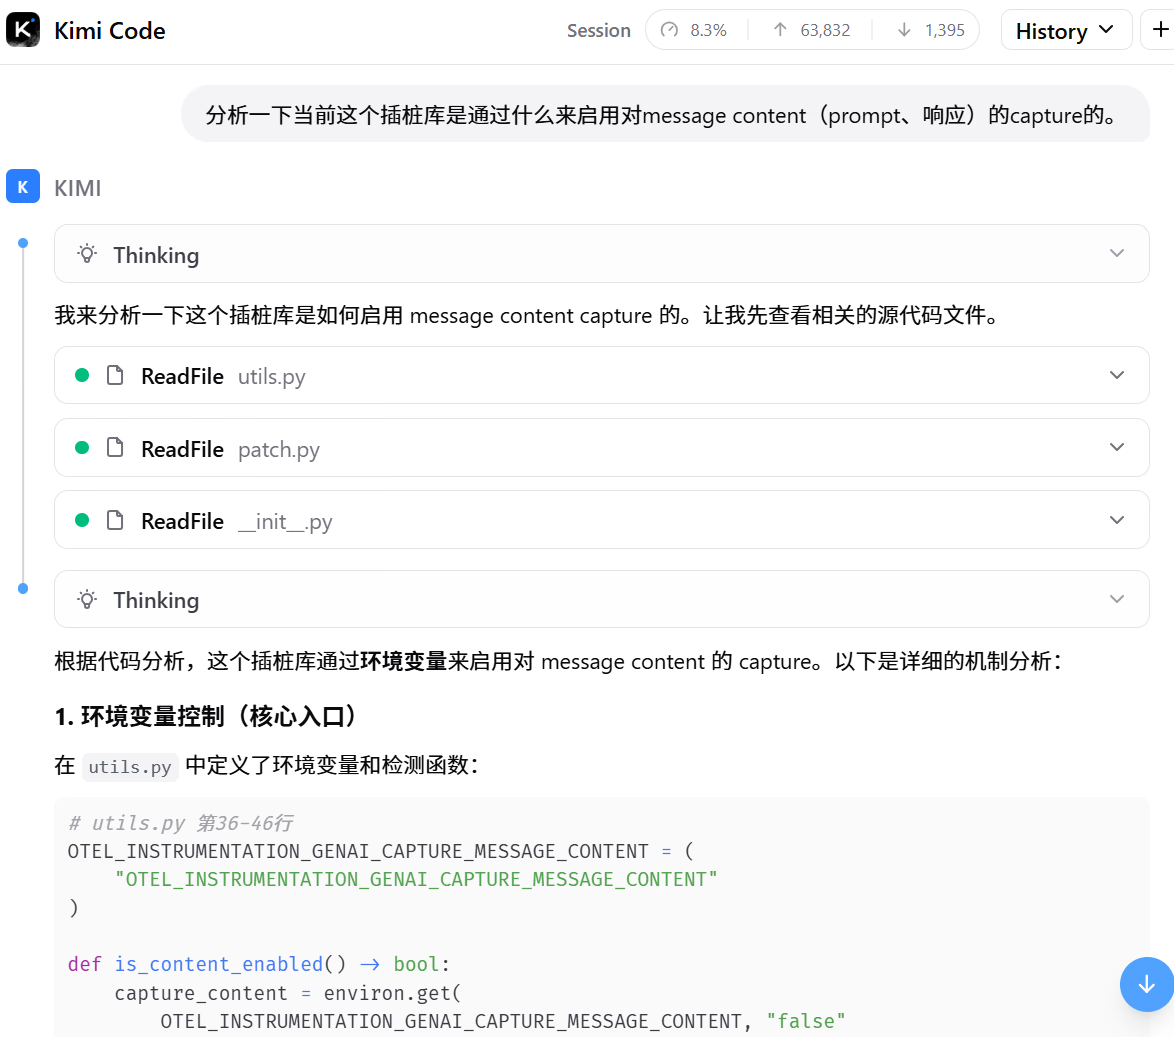
The v2 instrumentation library checks the environment variable for a specified value to decide whether to enable content capture. From the code, it's clear that enabling capture involves setting OTEL_INSTRUMENTATION_GENAI_CAPTURE_MESSAGE_CONTENT to true.
def is_content_enabled() -> bool:
    capture_content = environ.get(
        OTEL_INSTRUMENTATION_GENAI_CAPTURE_MESSAGE_CONTENT, "false"
    )
    return capture_content.lower() == "true"
But I remember seeing somewhere that values like span_only could be used. I suspect the README in this directory may not be updated: opentelemetry-python-contrib/instrumentation-genai/opentelemetry-instrumentation-openai-v2 at main · open-telemetry/opentelemetry-python-contrib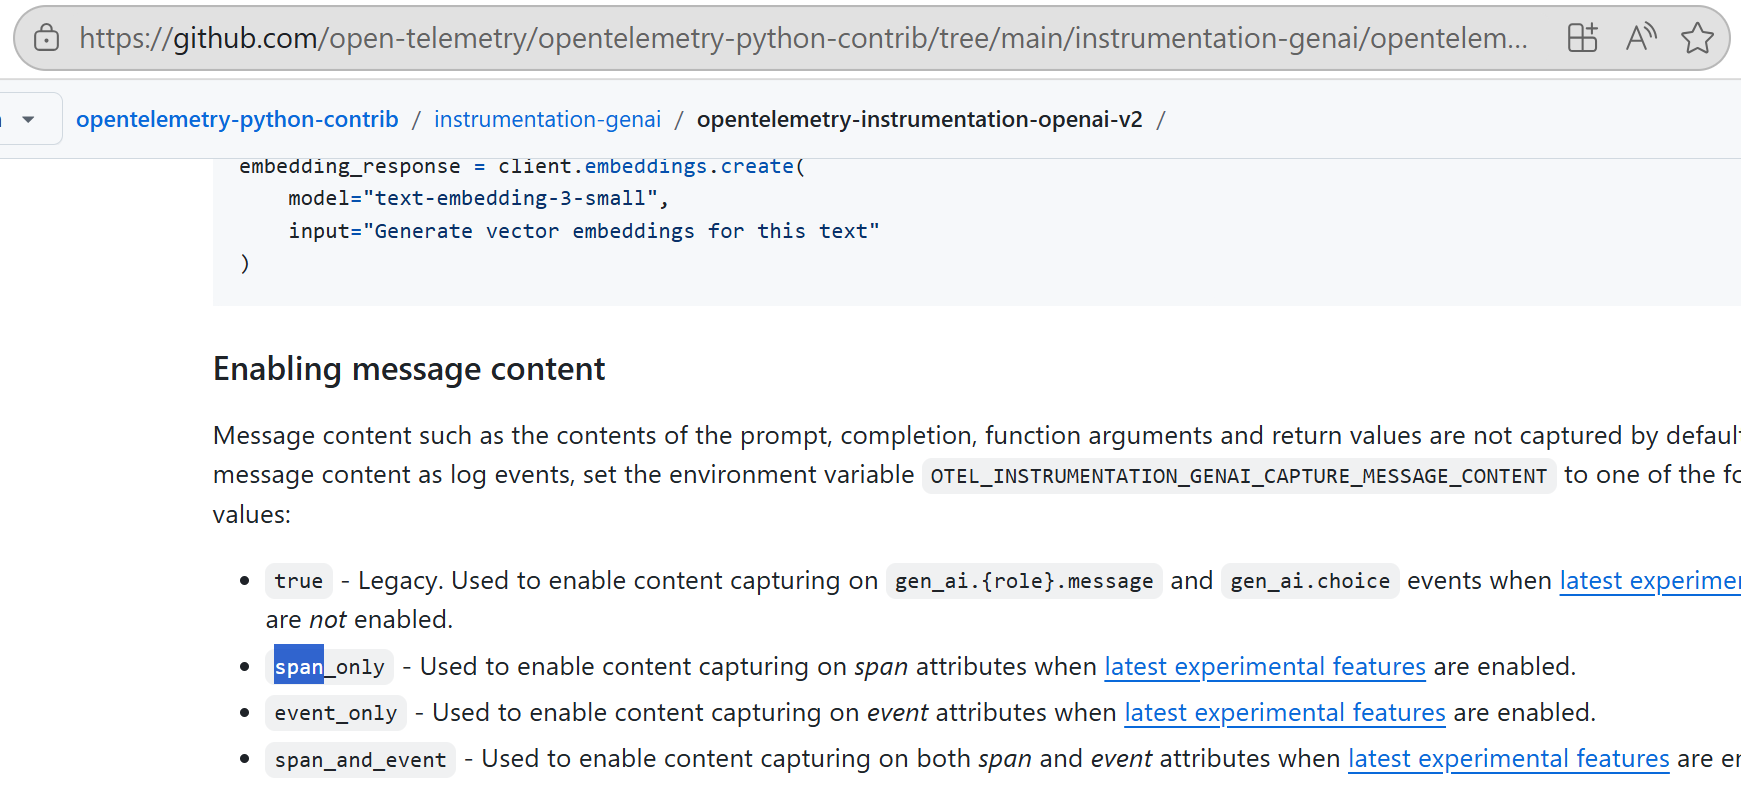
The Missing Message Content
From the OTel Collector, we can see that the Logs do record message content:
otel-collector-1   | 2026-03-04T09:22:29.617Z   info    ResourceLog #0
otel-collector-1   | Resource SchemaURL:
otel-collector-1   | Resource attributes:
otel-collector-1   |      -> telemetry.sdk.language: Str(python)
otel-collector-1   |      -> telemetry.sdk.name: Str(opentelemetry)
otel-collector-1   |      -> telemetry.sdk.version: Str(1.39.1)
otel-collector-1   |      -> service.name: Str(doubao-agent)
otel-collector-1   |      -> telemetry.auto.version: Str(0.60b1)
otel-collector-1   | ScopeLogs #0
otel-collector-1   | ScopeLogs SchemaURL: https://opentelemetry.io/schemas/1.30.0
otel-collector-1   | InstrumentationScope opentelemetry.instrumentation.openai_v2
otel-collector-1   | LogRecord #0
otel-collector-1   | ObservedTimestamp: 2026-03-04 09:22:27.074357614 +0000 UTC
otel-collector-1   | Timestamp: 1970-01-01 00:00:00 +0000 UTC
otel-collector-1   | SeverityText:
otel-collector-1   | SeverityNumber: Unspecified(0)
otel-collector-1   | EventName: gen_ai.choice
otel-collector-1   | Body: Map({"finish_reason":"stop","index":0,"message":{"content":"Beijing's current weather is sunny, temperature 25°C, feels quite comfortable.","role":"assistant"}})
otel-collector-1   | Attributes:
otel-collector-1   |      -> gen_ai.system: Str(openai)
otel-collector-1   | Trace ID: baa91d5ef281ad4b80f49c04cd6f9610
otel-collector-1   | Span ID: 89980c430c47742d
otel-collector-1   | Flags: 1
But the Langfuse platform currently only accepts Traces, so the message content is not visible. 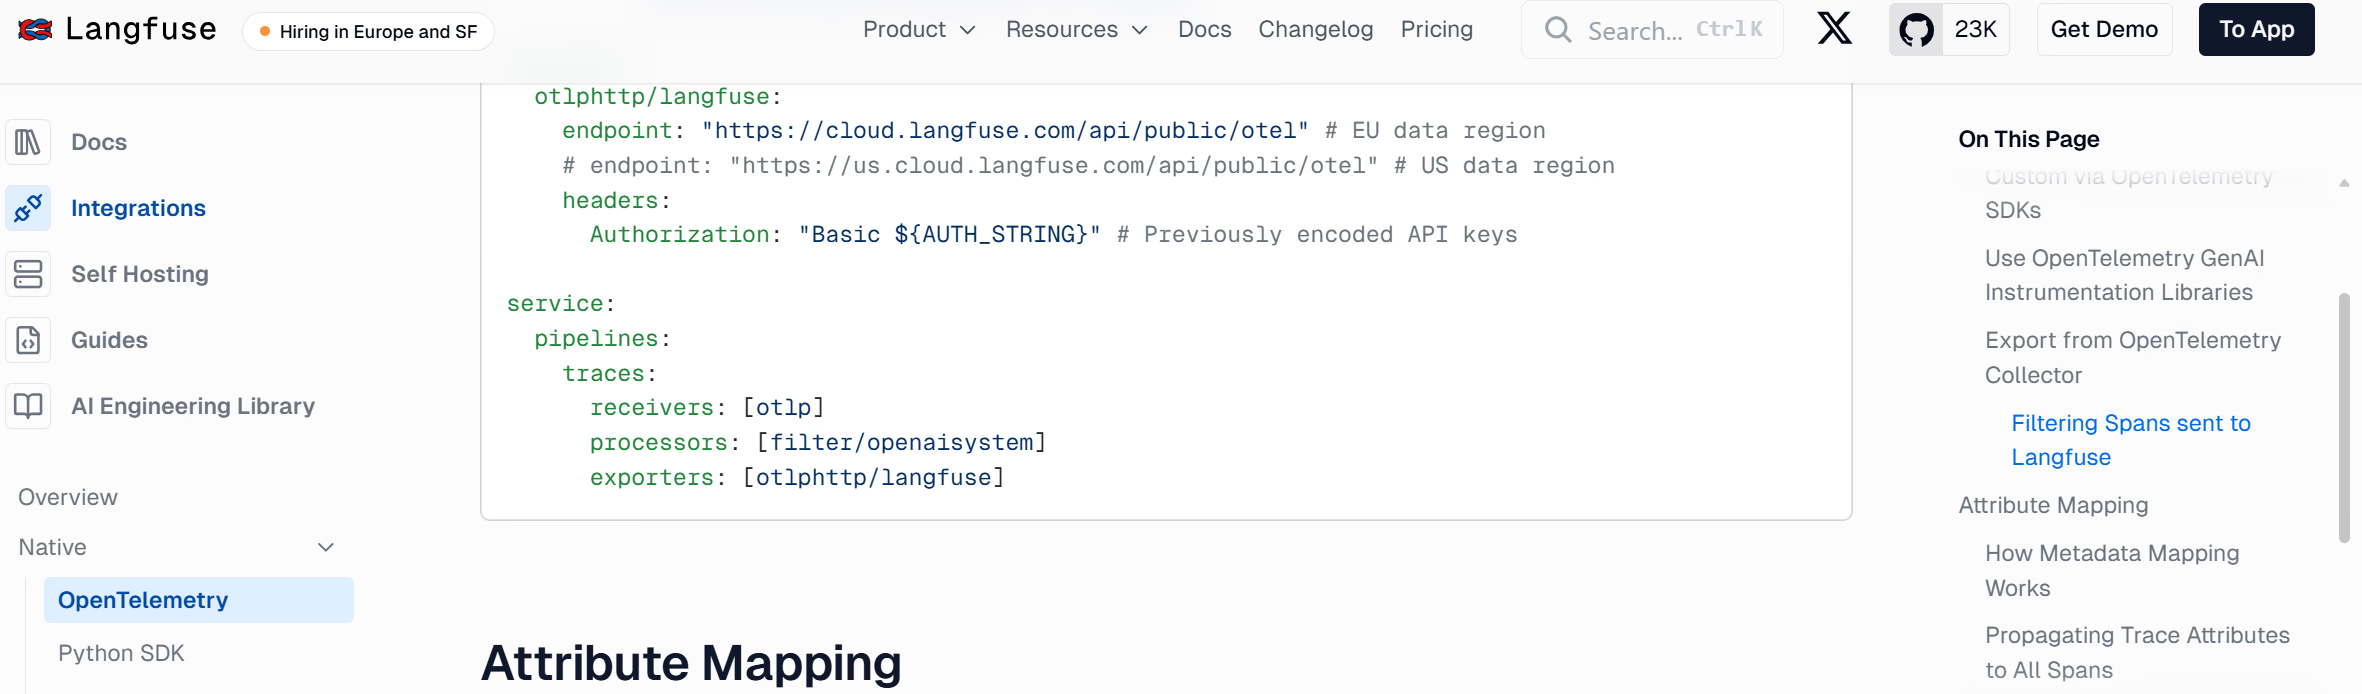
Summary
- Motivation: I wanted to implement observability for agent projects like ZeroClaw. First, I needed to understand what observability for large models actually looks like. Starting with the OpenAI SDK, I wanted to see what information can be captured after instrumentation, which metrics are available—this can guide future development and also help verify whether my observability implementation is correct.
- Process: Chose Langfuse as the large model observability backend. Instrumented the application using both Langfuse native and OTel methods.
- Conclusion:
- Langfuse's native instrumentation library is the most convenient to use and displays rich content on the Langfuse cloud platform.
- Using
opentelemetry-instrumentation-openai-v2captures most metrics but does not capture message content. - When running experiments, one must carefully consider the purpose and consequences of each step—don't just "autopilot" your way through.
- Next Steps:
- Carefully read the Langfuse documentation: Open Source LLM Observability via OpenTelemetry - Langfuse
- Try other instrumentation libraries to see if they produce richer telemetry signals.
- Attempt to use Grafana as the observability backend to see if Traces and Logs are automatically correlated/combined.
- Submit a PR to update the documentation at opentelemetry-python-contrib/instrumentation-genai/opentelemetry-instrumentation-openai-v2 at main · open-telemetry/opentelemetry-python-contrib