2026-03-12
Hands-on with a Greptime-based Agent Observability Solution
While scrolling through WeChat public accounts, I came across an article from Greptime about building an agent observability platform using their GreptimeDB.
Here’s what the result looks like: 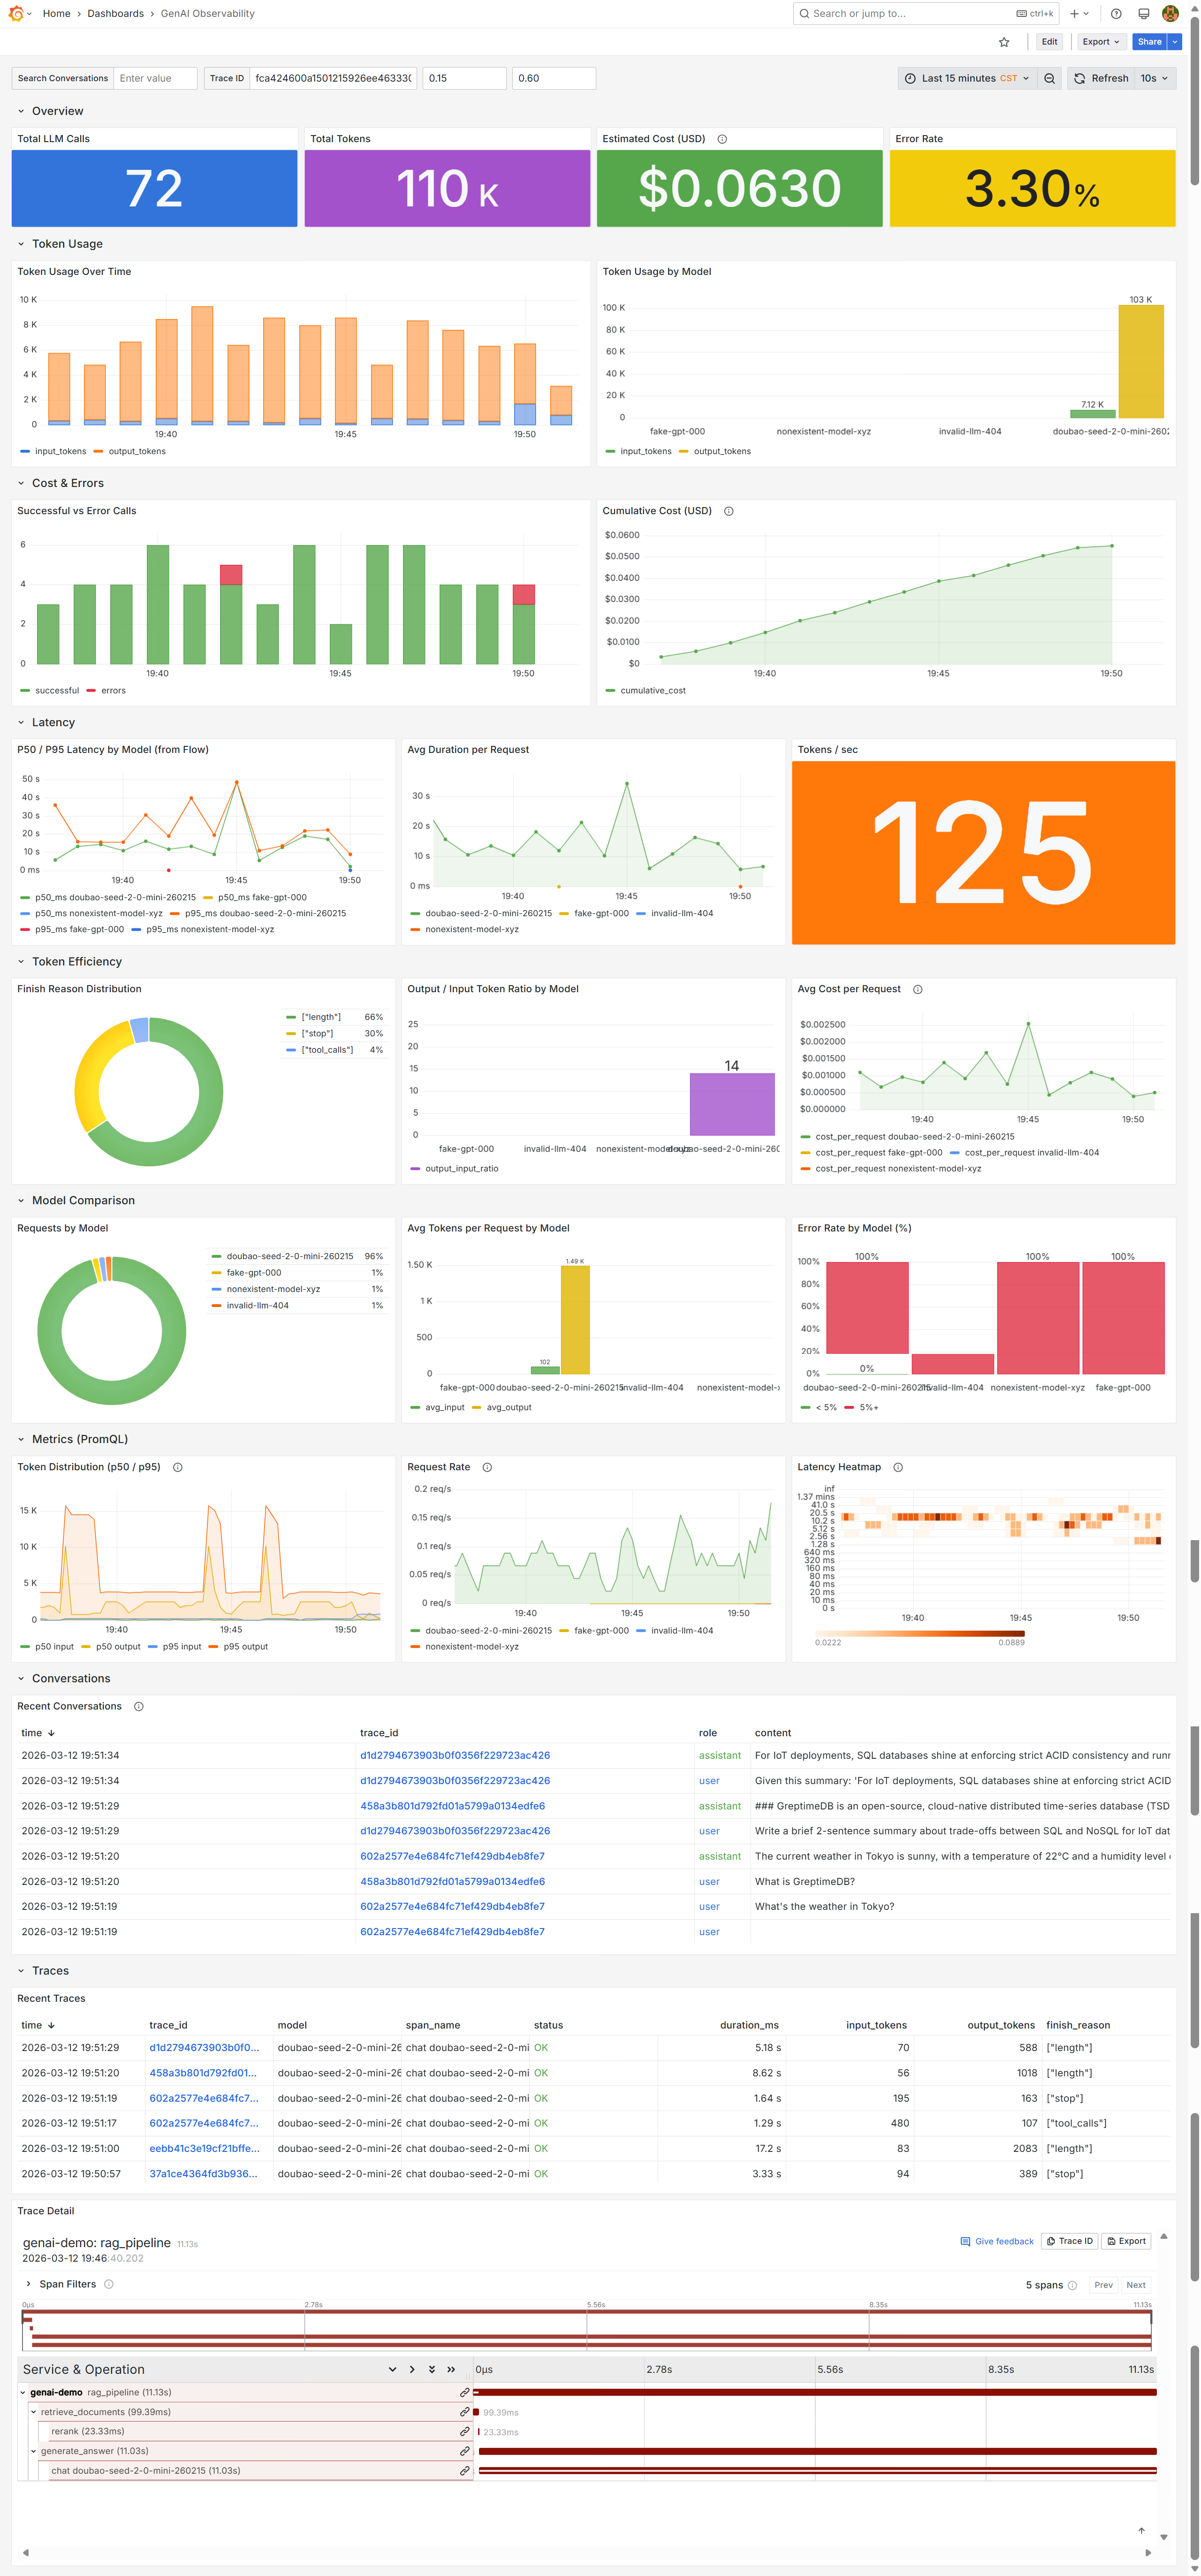
The architecture (generated by Kimi based on the original article) is shown below:
%%{init: {'theme': 'base', 'themeVariables': { 'primaryColor': '#E8F5E9', 'primaryTextColor': '#1B5E20', 'primaryBorderColor': '#4CAF50', 'lineColor': '#FF9800', 'secondaryColor': '#E3F2FD', 'tertiaryColor': '#FFF3E0', 'fontFamily': 'Inter', 'clusterBkg': '#FAFAFA', 'clusterBorder': '#E0E0E0', 'titleColor': '#212121'}}}%%

flowchart TB
    subgraph App["🚀 GenAI App (Python)"]
        direction TB
        A1["OpenAI SDK / Anthropic / Azure / Bedrock"]
        A2["opentelemetry-instrumentation-openai-v2"]
        A3["Auto-generates Traces + Metrics + Logs"]
        A4["OTEL_INSTRUMENTATION_GENAI_CAPTURE_MESSAGE_CONTENT=true"]
        A5["Captures full Prompt / Completion"]
    end

    subgraph Transport["📡 Data Transport"]
        direction TB
        T1["OTLP/HTTP direct write to GreptimeDB"]
        T2["No OTel Collector (Demo/Small Scale)"]
        T3["In production, add Collector for sampling/masking"]
    end

    subgraph GreptimeDB["🗄️ GreptimeDB Unified Backend"]
        direction TB

        subgraph Ingestion["Data Ingestion Endpoints"]
            I1["/v1/otlp/v1/traces → opentelemetry_traces"]
            I2["/v1/otlp/v1/metrics → OTel metrics"]
            I3["/v1/otlp/v1/logs → genai_conversations"]
        end

        subgraph Storage["Data Storage"]
            S1["opentelemetry_traces"]
            S1_detail["span_attributes.gen_ai.* flattened into columns"]
            S2["genai_conversations"]
            S2_detail["body column full-text indexed, searchable conversation content"]
            S3["OTel Metrics (Histogram)"]
            S3_detail["gen_ai_client_operation_duration_seconds"]
            S4["gen_ai_client_token_usage"]
        end

        subgraph Flow["⚡ Flow Stream Processing Engine"]
            F1["genai_token_usage_1m"]
            F1_detail["Per-minute token aggregation per model"]
            F2["genai_latency_1m"]
            F2_detail["uddsketch percentiles p50/p95/p99"]
            F3["Auto-expire EXPIRE AFTER '24h'"]
        end
    end

    subgraph Grafana["📊 Grafana Unified Visualization"]
        direction TB

        subgraph SQLPanel["SQL Query Panel"]
            G1["Cross-table join: traces JOIN conversations"]
            G1_detail["Join via trace_id + span_id"]
            G2["Full-text search: matches_term(body, 'keyword')"]
            G3["Cost estimation / Error rate statistics"]
        end

        subgraph PromQLPanel["PromQL Query Panel"]
            G4["histogram_quantile(0.95, ...)"]
            G5["Token distribution / Latency percentiles"]
        end

        subgraph TracePanel["Trace Waterfall"]
            G6["GreptimeDB Grafana Plugin"]
            G6_detail["Nested span tree: tool_call / RAG / multi-agent"]
            G7["Click trace_id to jump directly"]
        end
    end

    App --> Transport
    Transport --> GreptimeDB
    GreptimeDB --> Grafana

    %% Style definitions
    style App fill:#E8F5E9,stroke:#2E7D32,stroke-width:3px,color:#1B5E20
    style A1 fill:#C8E6C9,stroke:#4CAF50,stroke-width:2px,color:#1B5E20
    style A2 fill:#A5D6A7,stroke:#4CAF50,stroke-width:2px,color:#1B5E20
    style A3 fill:#C8E6C9,stroke:#4CAF50,stroke-width:1px,color:#2E7D32
    style A4 fill:#E8F5E9,stroke:#81C784,stroke-width:1px,color:#2E7D32
    style A5 fill:#E8F5E9,stroke:#81C784,stroke-width:1px,color:#2E7D32

    style Transport fill:#FFF8E1,stroke:#F57F17,stroke-width:2px,color:#E65100
    style T1 fill:#FFECB3,stroke:#FFB300,stroke-width:2px,color:#E65100
    style T2 fill:#FFF8E1,stroke:#FFD54F,stroke-width:1px,color:#F57F17
    style T3 fill:#FFF8E1,stroke:#FFD54F,stroke-width:1px,color:#F57F17

    style GreptimeDB fill:#E3F2FD,stroke:#1565C0,stroke-width:3px,color:#0D47A1
    style Ingestion fill:#BBDEFB,stroke:#1976D2,stroke-width:2px,color:#0D47A1
    style I1 fill:#E3F2FD,stroke:#42A5F5,stroke-width:1px,color:#1565C0
    style I2 fill:#E3F2FD,stroke:#42A5F5,stroke-width:1px,color:#1565C0
    style I3 fill:#E3F2FD,stroke:#42A5F5,stroke-width:1px,color:#1565C0
    style Storage fill:#BBDEFB,stroke:#1976D2,stroke-width:2px,color:#0D47A1
    style S1 fill:#E3F2FD,stroke:#42A5F5,stroke-width:1px,color:#1565C0
    style S1_detail fill:#E3F2FD,stroke:#90CAF9,stroke-width:1px,color:#1565C0
    style S2 fill:#E3F2FD,stroke:#42A5F5,stroke-width:1px,color:#1565C0
    style S2_detail fill:#E3F2FD,stroke:#90CAF9,stroke-width:1px,color:#1565C0
    style S3 fill:#E3F2FD,stroke:#42A5F5,stroke-width:1px,color:#1565C0
    style S3_detail fill:#E3F2FD,stroke:#90CAF9,stroke-width:1px,color:#1565C0
    style S4 fill:#E3F2FD,stroke:#42A5F5,stroke-width:1px,color:#1565C0
    style Flow fill:#BBDEFB,stroke:#1976D2,stroke-width:2px,color:#0D47A1
    style F1 fill:#E3F2FD,stroke:#42A5F5,stroke-width:1px,color:#1565C0
    style F1_detail fill:#E3F2FD,stroke:#90CAF9,stroke-width:1px,color:#1565C0
    style F2 fill:#E3F2FD,stroke:#42A5F5,stroke-width:1px,color:#1565C0
    style F2_detail fill:#E3F2FD,stroke:#90CAF9,stroke-width:1px,color:#1565C0
    style F3 fill:#E3F2FD,stroke:#42A5F5,stroke-width:1px,color:#1565C0

    style Grafana fill:#FFF3E0,stroke:#E65100,stroke-width:3px,color:#BF360C
    style SQLPanel fill:#FFE0B2,stroke:#F57C00,stroke-width:2px,color:#E65100
    style G1 fill:#FFF3E0,stroke:#FFB74D,stroke-width:1px,color:#E65100
    style G1_detail fill:#FFF3E0,stroke:#FFCC80,stroke-width:1px,color:#E65100
    style G2 fill:#FFF3E0,stroke:#FFB74D,stroke-width:1px,color:#E65100
    style G3 fill:#FFF3E0,stroke:#FFB74D,stroke-width:1px,color:#E65100
    style PromQLPanel fill:#FFE0B2,stroke:#F57C00,stroke-width:2px,color:#E65100
    style G4 fill:#FFF3E0,stroke:#FFB74D,stroke-width:1px,color:#E65100
    style G5 fill:#FFF3E0,stroke:#FFB74D,stroke-width:1px,color:#E65100
    style TracePanel fill:#FFE0B2,stroke:#F57C00,stroke-width:2px,color:#E65100
    style G6 fill:#FFF3E0,stroke:#FFB74D,stroke-width:1px,color:#E65100
    style G6_detail fill:#FFF3E0,stroke:#FFCC80,stroke-width:1px,color:#E65100
    style G7 fill:#FFF3E0,stroke:#FFB74D,stroke-width:1px,color:#E65100
Differences from Traditional Solutions
When observing LLM applications, we usually need to monitor multiple types of data simultaneously, which requires jumping from Traces to Logs. I encountered this in a previous practice — although you can set up Traces to Logs in the Jaeger data source, it doesn't embed the LLM messages recorded in Logs into the spans of the Trace waterfall. Instead, it requires a click to navigate, which falls short in user experience compared to observability platforms specifically designed for agents like Langsmith and Langfuse.
Unlike traditional approaches that store the three signals separately, this solution stores them all in a single GreptimeDB database. On the application side, you simply configure the three signals to be sent to specific endpoints.
Greptime's Advantages
Summary from Yuanbao:
Unified storage of three signals with cross-signal correlation queries: Traces, Metrics, and Logs are stored in different tables within GreptimeDB, but they share correlation keys like
trace_id. This allows a single SQL query to correlate, for example, the token usage of a high-latency request with its full conversation content, solving the problem of manually splicing data across multiple systems in traditional solutions.Real-time aggregation from raw spans to metrics using Flow: No need for duplicate metric reporting from the application layer. GreptimeDB's stream processing engine, Flow, allows you to define aggregation tasks that directly aggregate key metrics (e.g., per-minute token usage, latency percentiles via
uddsketch) from raw span data with rich attributes, avoiding dual-write and redundant computation.Searchable raw conversation content with seamless Trace linking: When content capture is enabled, full user prompts and AI responses can be stored as logs and indexed with full-text search using the
matches_term()function. In the Grafana dashboard, you can search for conversation keywords and directly link to the corresponding Trace waterfall viatrace_id, enabling rapid tracing from symptom ("AI response is poor") to root cause (slow queries, specific tool calls, etc.).
Data Not Found?
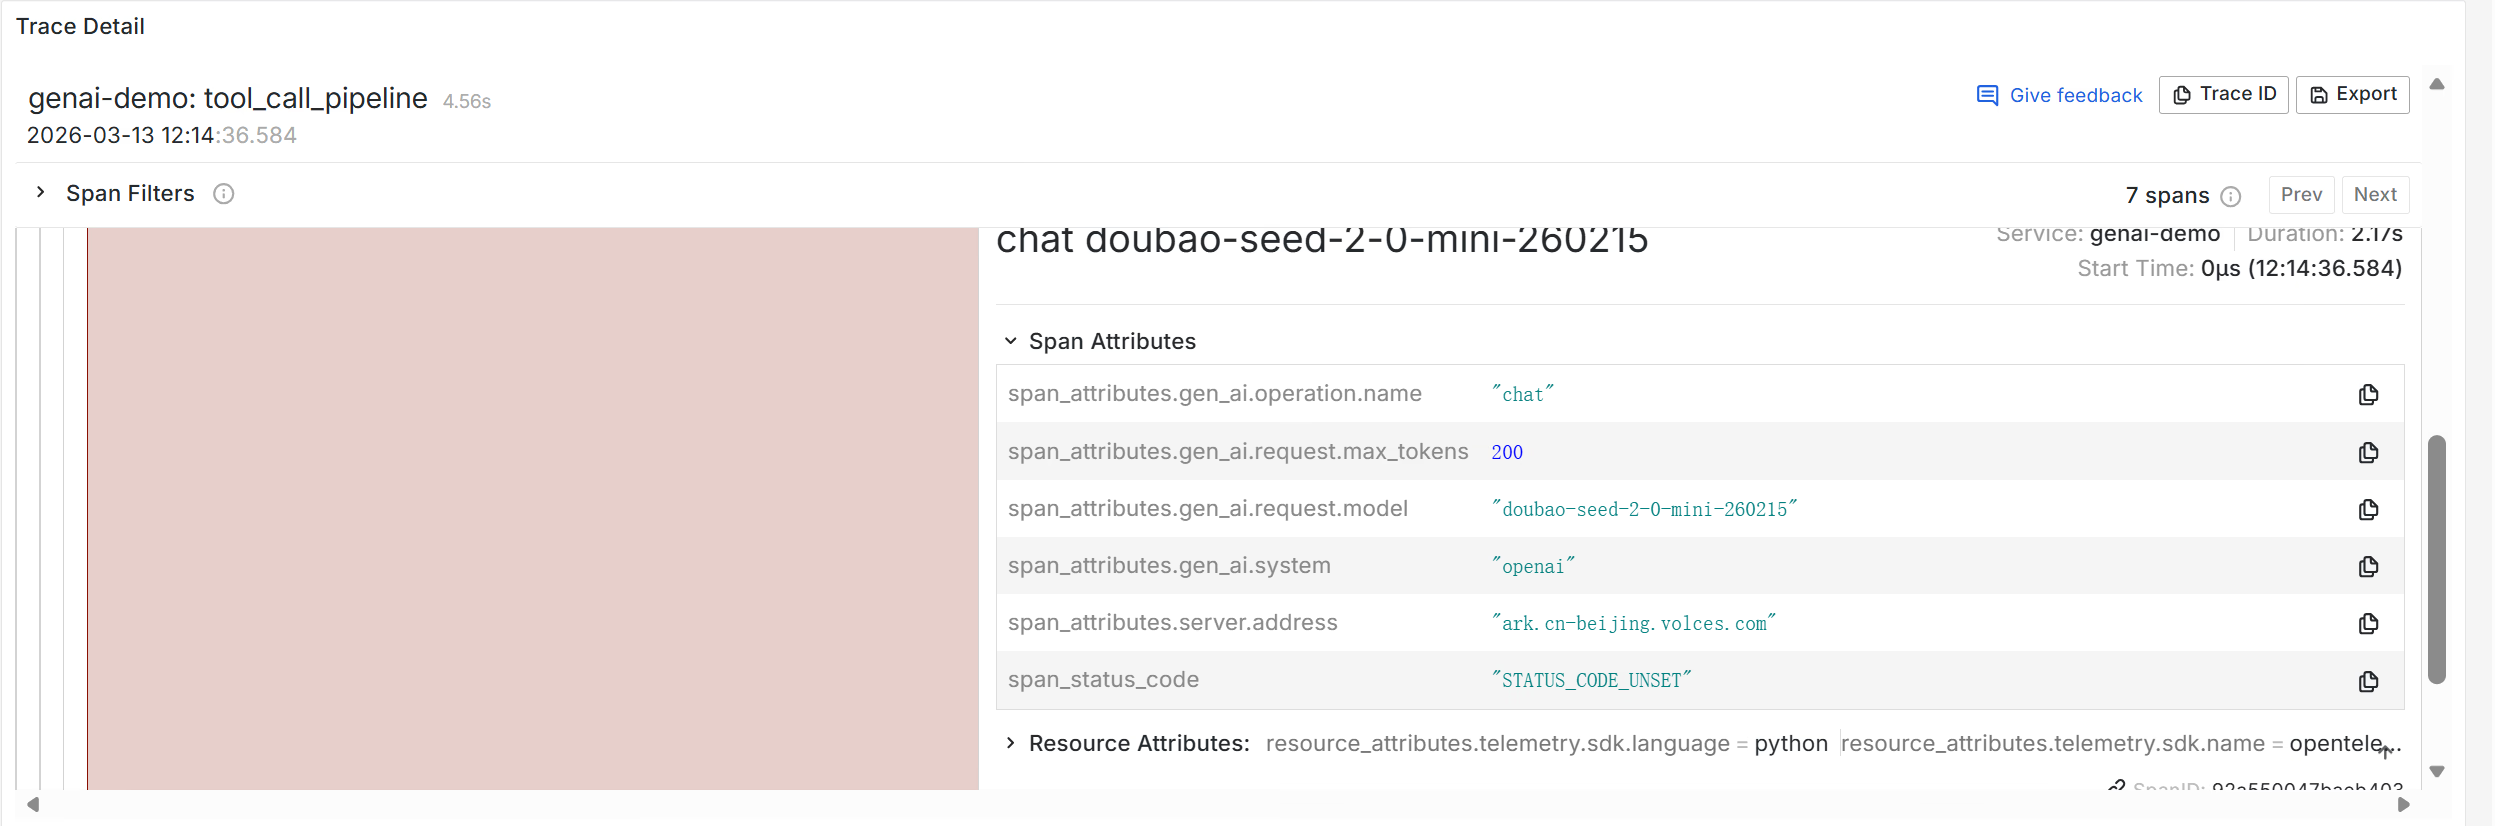
I hit a small snag during the experience — I couldn't click to expand the span attributes in the Trace waterfall.
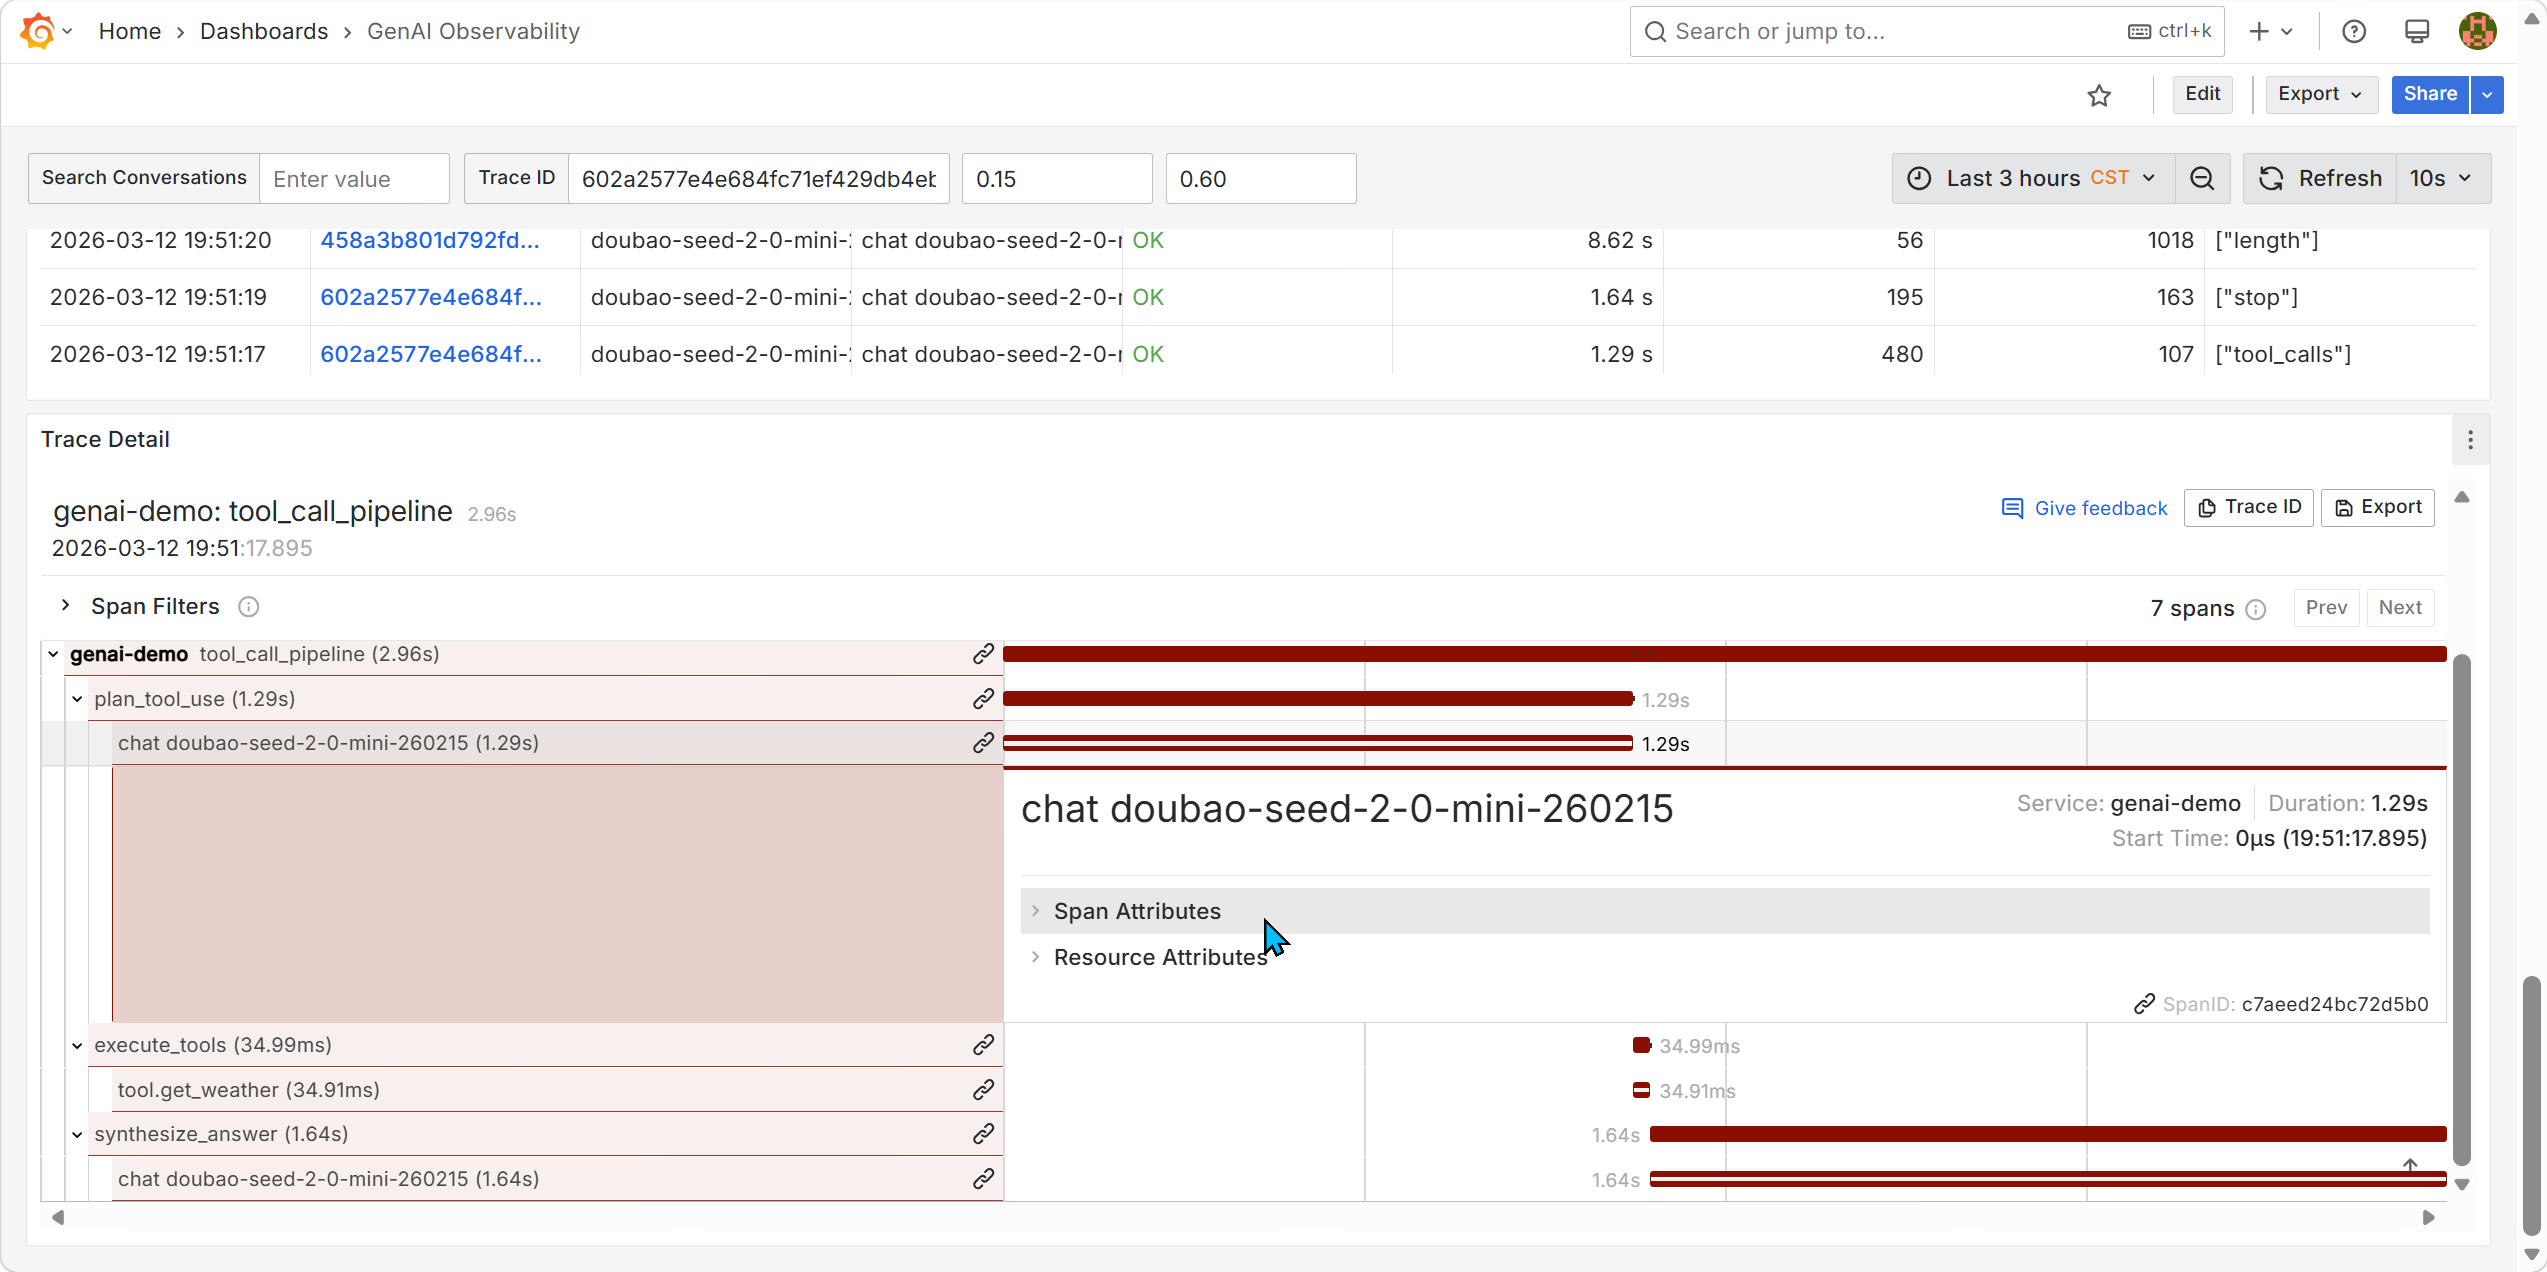
I tried to analyze the issue:
- Understand how this visualization is constructed
- Click Edit to enter edit mode
- Found that this content is generated via SQL queries through the GreptimeDB plugin
- Hypothesis: Is there something wrong with the SQL query? Ran the query in the GreptimeDB panel — it worked fine.
- Hypothesis: Are span attributes not recorded? Checked the
opentelemetry_tracestable and confirmed they were recorded. - Hypothesis: Does it have something to do with the Columns/Tags column? But when I selected them, it showed "Data Not Found".
By then it was 8 PM, so I asked the expert teachers in the GreptimeDB technical discussion group about this issue. I figured I'd have the answer after waking up. But to my surprise, the development team fixed it by 9 PM.
How did they fix it? Through Git Diff, I found that changes were made in the grafana/dashboards/genai.json file, specifically modifying the panel's query (rawSql) and column definitions (columns).
I spun up a new Grafana container, and sure enough!
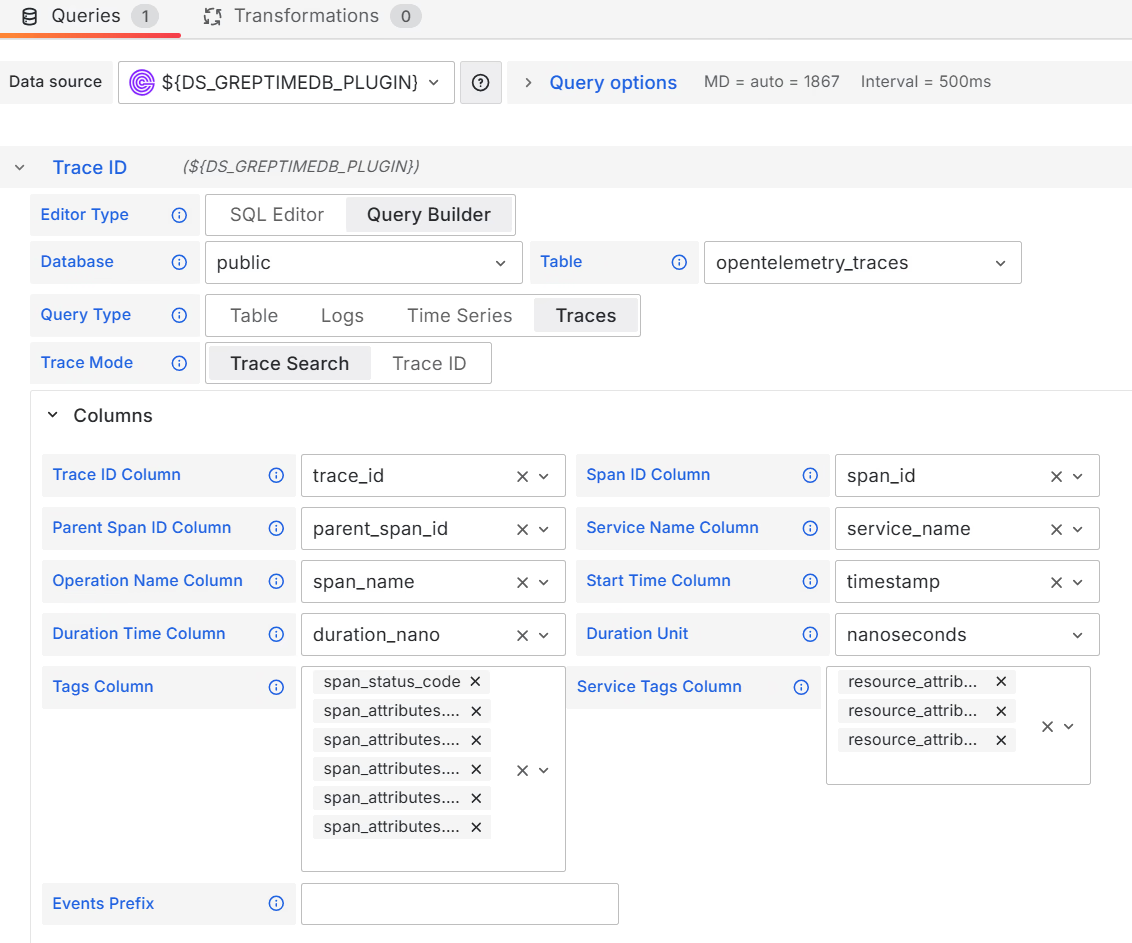
Now I can see the span attributes content.